Archive
Forefront TMG Performance Troubleshooting with PAL v2.x Part 2 – Data Analysis and Reporting
In the first part of this two-part series we used PAL and Performance Monitor to collect data. In this second part I’ll demonstrate how to use PAL to analyze the data and generate a report.
Analyzing the Data
Once you’ve collected the necessary log data you are ready to analyze it using PAL. To begin, open the PAL tool, click Next or select the Counter Log tab, then choose the path to the log file collected using Performance Monitor.
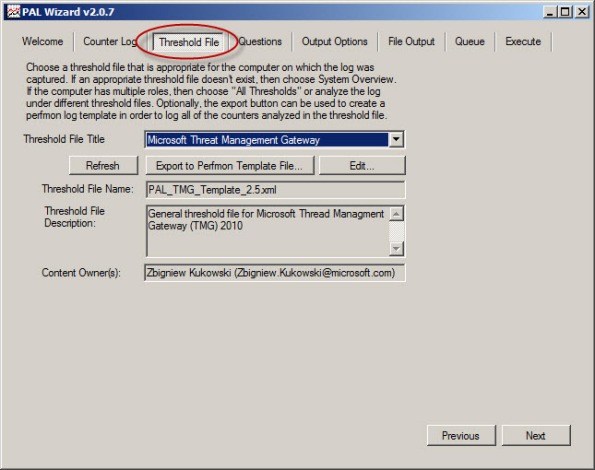
Select Microsoft Forefront Threat Management Gateway for the threshold file and choose Next.
To accurately analyze the data, PAL needs to know specific details about the system where the log data was collected. Highlight and answer each question and choose Next.
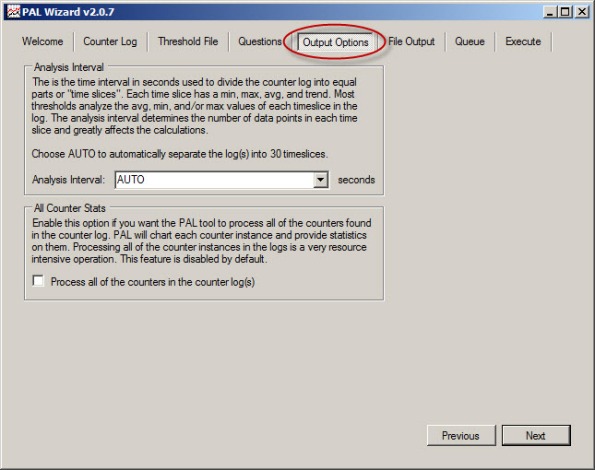
Accept the default settings for Analysis Interval and All Counter Stats.
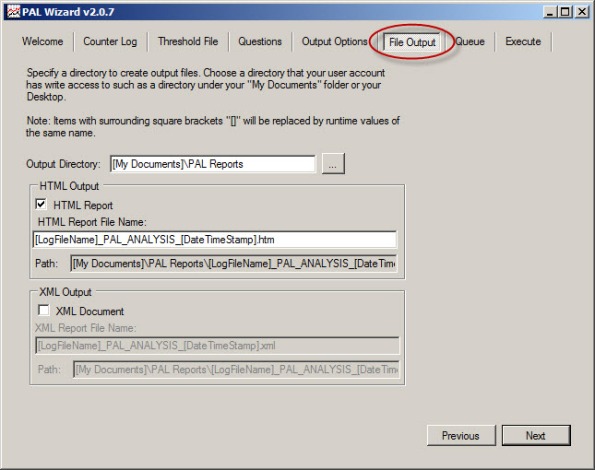
By default, PAL generates reports in HTML format and places them in the My Documents\PAL Reports folder. Here you can change the default file location and also select the option to generate reports in XML format.
Behind the scenes PAL leverages a complex PowerShell script to perform analysis and generate reports.
To perform the analysis and generate a report, click Finish. Optionally you can add the analysis job to the job queue or execute the analysis and restart the wizard with the same settings. You can also select the option to execute as a low priority process.
PAL begins analyzing the log data and once complete it generates a report in the format specified. You can view a sample report here.
The report is very detailed and includes alerts when a particular counter exceeds a predetermined threshold. The alerts are color coded to easily identify when a threshold has been exceeded. The report also includes a brief explanation of each counter, a graphical chart of the data analyzed, and statistical data relating to the counter.
PAL is a wonderful tool that greatly simplifies the process of analyzing Performance Monitor data. It is not, however, a magic wand that will solve all of your performance issues automatically. Although the tool provides a wealth of information in a clear and concise format, it is still up to the administrator to understand the data and ultimately determine how best to resolve the issue. PAL just makes that task much easier.
Forefront TMG Performance Troubleshooting with PAL v2.x Part 1 – Data Collection
Forefront TMG Performance Troubleshooting with PAL v2.x Part 2 – Data Analysis and Reporting
Forefront TMG Performance Troubleshooting with PAL v2.x Part 1 – Data Collection
Troubleshooting performance issues on any system, especially a Forefront Threat Management Gateway (TMG) 2010 firewall can be a significant challenge for many administrators. The primary tool used for this task is the Windows Performance Monitor. This tool allows the administrator to monitor virtually every aspect of the operating system, applications, and hardware. However, deciding which objects and counters to monitor and how to interpret the data can be difficult.
That’s where Performance Analysis of Logs (PAL) comes in. Created by Microsoft Premiere Field Engineer (PFE) Clint Huffman, this free tool automates the analysis of logged data collected using Performance Monitor. PAL uses templates along with user input to analyze and report on the collected log information. It eliminates guesswork by highlighting counters that exceed predefined thresholds. PAL has been around for many years, but until recently has lacked support for Forefront TMG. Thanks to the effort and hard work by some Forefront PFE’s and CSS engineers, the recent release of PAL v2.0.7 now fully supports Forefront TMG.
PAL can be found at http://pal.codeplex.com/. It is available for 32- and 64-bit systems, and requires that Microsoft .NET Framework 3.5 SP1, Microsoft Chart Controls for .NET Framework 3.5, and PowerShell v2.0 be installed.
In this first part of a two-part series we’ll first look at how to use PAL to configure Performance Monitor to collect the necessary data. In the second part will use PAL to analyze the data and generate a report.
Collecting Data
Enabling private Performance Monitor counters is required to fully analyze performance on the Forefront TMG firewall. Enabling private Performance Monitor counters is accomplished be creating the following registry key on the Forefront TMG firewall:
HKLM\SOFTWARE\Microsoft\RAT\Stingray\Debug\FWSRV
"FWS_PRIVATE_PERFORMANCE_COUNTERS"=dword:00000001
Download .reg file here.
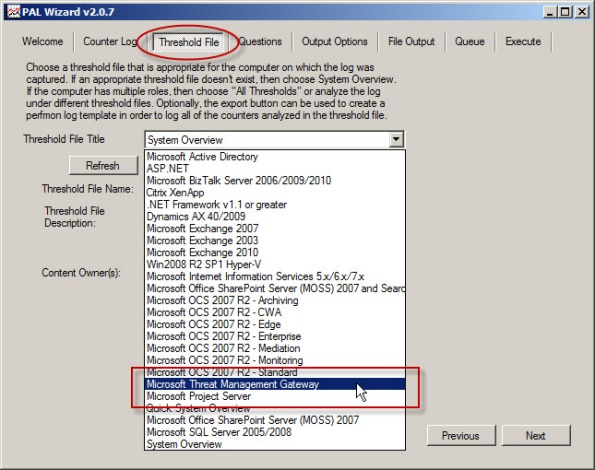
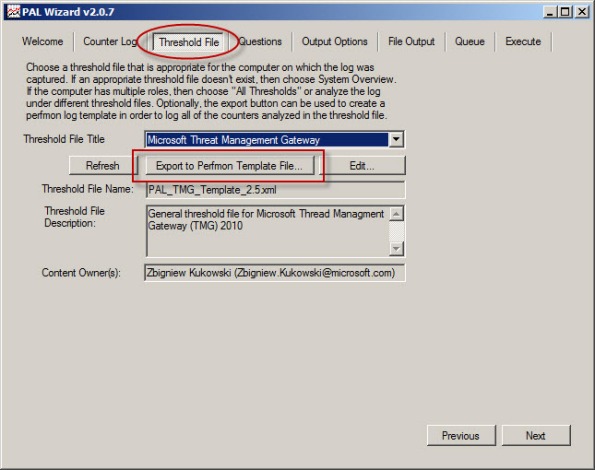
To begin collecting performance data on the Forefront TMG firewall, open the PAL tool and select the Threshold File tab, then click the drop-down box and choose Microsoft Threat Management Gateway.
Click Export to Perfmon Template File… and save the file.
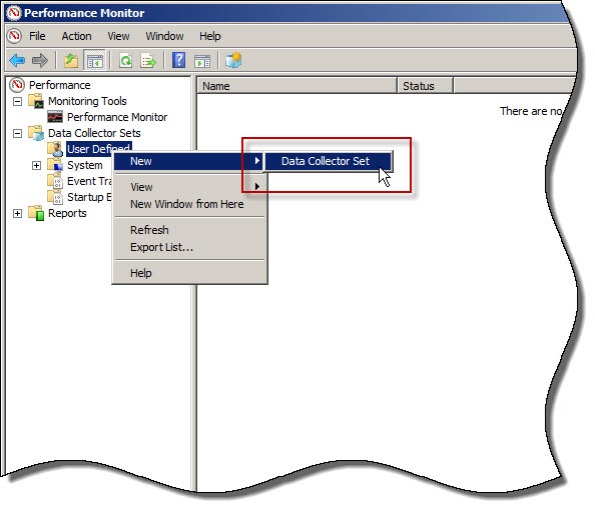
On the TMG firewall, open the Performance Monitor, expand Data Collector Sets, and then right-click User Defined and choose New -> Data Collector Set.
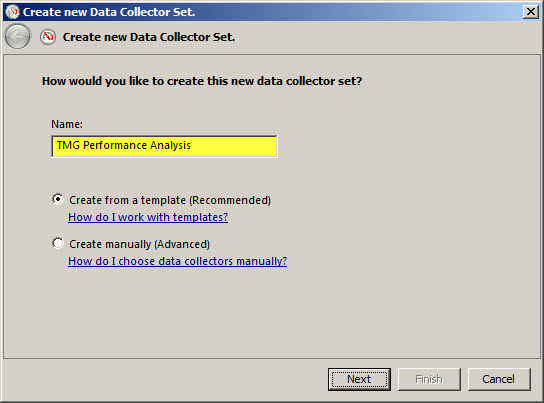
Give the new data collector set a descriptive name, select the option to Create from a template, then click Next.
When the wizard prompts for which template to use, click Browse…, then select the PAL template file exported earlier.
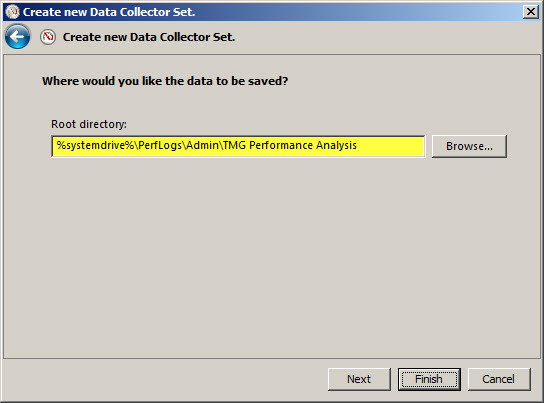
Specify the folder where the logged data will be saved and click Finish.
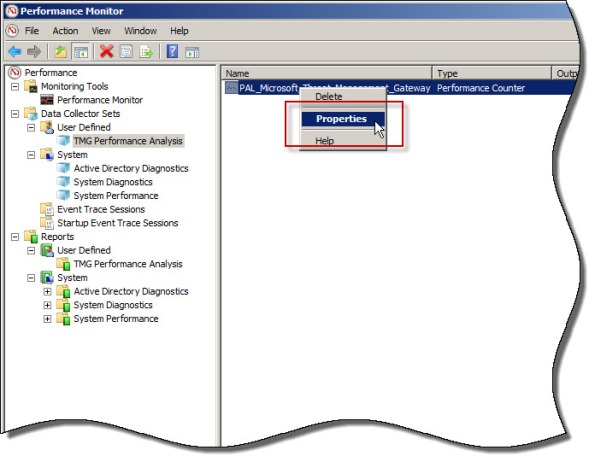
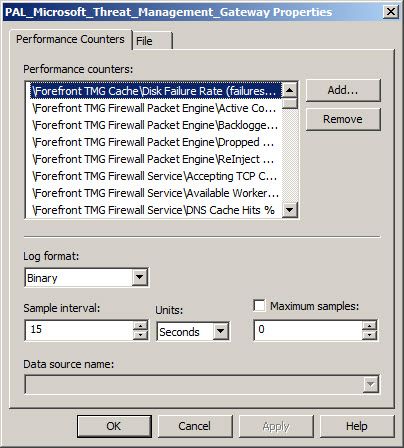
Once complete, the new data collector set will appear. If you right-click the new collector set and choose Properties… you will see that it contains all of the necessary Performance Monitor objects and counters required to perform an in-depth performance analysis of the Forefront TMG firewall. Here you can also change parameters such as the log format (binary log format is recommend, however) and sample interval. You can also change file parameters such as the log file name, the file name format, and the logging mode (overwrite, append, or circular).
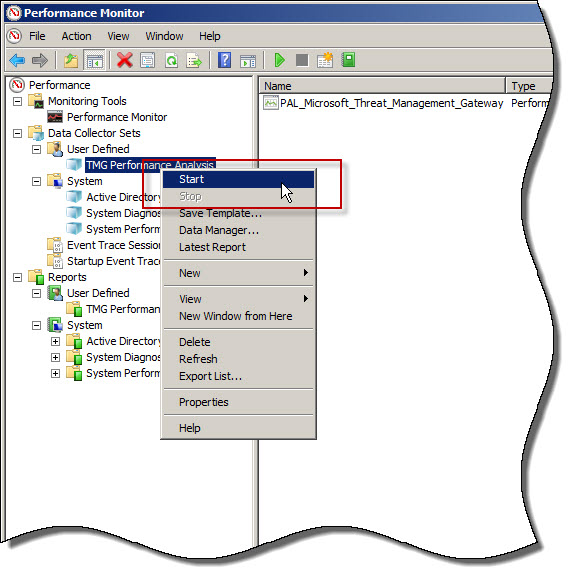
To start collecting data, right-click the data collector set and choose Start. Once the capture has started, you can right-click and select Stop to stop the capture.
You can also schedule data collection by right-clicking the data collector set and choosing Properties, clicking the Schedule tab, and then clicking Add.
You can also specify a stop condition that will cease data collection based on any number of different parameters including duration and size of the log file.
In the second part of this two-part series we’ll outline how to use PAL to analyze and generate reports of the Performance Monitor data.
Forefront TMG Performance Troubleshooting with PAL v2.x Part 1 – Data Collection
Forefront TMG Performance Troubleshooting with PAL v2.x Part 2 – Data Analysis and Reporting

