Archive
Disable SSL 3.0 and TLS 1.0 on Forefront TMG and UAG 2010
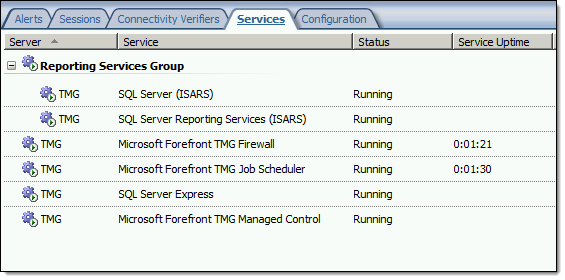
When performing SSL and TLS hardening on Microsoft Forefront Threat Management Gateway (TMG) 2010 or Forefront Unified Access Gateway (UAG) 2010 servers, disabling SSL 3.0 and TLS 1.0 is often required to meet regulatory and compliance guidelines for security. However, disabling SSL 3.0 and TLS 1.0 causes the SQL Server (ISARS) and SQL Server Express services to fail on start up.

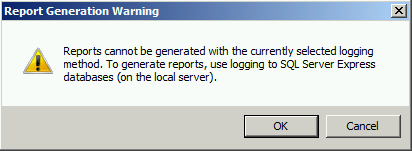
Switching from SQL logging to text file logging can be employed as a workaround. However, when using text file logging, generating historical reports in the TMG management console is no longer supported.
To restore full functionality for SQL logging and reporting when SSL 3.0 and TLS 1.0 are both disabled, an update to the local security policy of the server is required. Open the Local Security Policy editor by clicking on the Start button and navigating to Administrative Tools and Local Security Policy. Expand Local Policies and click on Security Options. Double-click on System cryptography: Use FIPS compliant algorithms for encryption, hashing, and signing. Click Enabled and then click OK.

Restart the computer for the changes to take effect. Once complete, all SQL services should start and run without issue.
Note: If Remote Desktop Services (RDS) is used to manage the Forefront TMG firewall it will be necessary to install update KB3080079.
Troubleshooting with the Windows Sysinternals Tools 2nd Edition Now Available
The Windows Sysinternals utilities are essential tools for troubleshooting Windows platforms and systems. The tools are being updated constantly, and recently a 2nd edition of the book “Troubleshooting with the Windows Sysinternals Tools” was released. This is an important reference for anyone using these tools to perform Windows troubleshooting. Order your copy today!

ISAinfo Forefront TMG 2010 Configuration Reporting Utility
 With the demise of isatools.org a few years ago, many ISA Server and Forefront TMG 2010 administrators have reached out to me to ask where they can find the ISAinfo tool that was previously found on that site. If you’re not familiar with ISAinfo, it was a great utility used for viewing the ISA or TMG configuration by parsing the configuration export. This tool is tremendously useful for providing support, as it includes all of the information required to provide context for troubleshooting. In addition it is an excellent documentation tool.
So, if you’re looking for a reputable location from which to download this tool, look no further. I’ve placed the isainfo.zip file along with the checksums for file verification on my public OneDrive. Enjoy!
ISAinfo.zip – http://1drv.ms/1Q8GOaA
Checksums – http://1drv.ms/1Q8GWqq
PAL v2.3.3 Now with Forefront UAG 2010 Support
Recently the Performance Analysis of Logs (PAL) tool was updated and now includes a threshold file for Forefront UAG 2010. PAL is an essential utility that can make troubleshooting performance issues or capacity planning dramatically easier. I’ve written about using PAL on Forefront TMG 2010 in the past, and using PAL with Forefront UAG 2010 will be very similar. You can download the latest release of PAL at pal.codeplex.com.
Bug in Forefront TMG 2010 Service Pack 2
Today I confirmed a bug in Service Pack 2 (SP2) for Forefront TMG 2010 that was discovered by Jason Jones. If you have deleted the default Internet Access network rule and replaced it with something else, installing SP2 for Forefront TMG 2010 mysteriously restores this rule. Unfortunately it places the default Internet Access rule ahead of your custom rule which in most cases will cause serious problems. This bug only affects Forefront TMG 2010 configurations where the default Internet Access network rule has been specifically deleted. If you’ve altered this rule in any way, those changes are unaffected.
Before Forefront TMG SP2 installation…

After Forefront TMG SP2 installation…

Access to the Web Proxy Filter on Forefront TMG 2010 is Denied
Frequently I am asked to review Forefront TMG 2010 firewall logs for suspicious behavior. Often times a security administrator will express concerns about many instances of denied requests by clients attempting to connect to Forefront TMG’s web proxy service. On busy TMG firewalls there may be hundreds or even thousands of instances where the following access denied record appears in the Web Proxy logs:
Status: 12209 Forefront TMG requires authorization to fulfill the request.
Access to the Web Proxy filter is denied.

On a Forefront TMG 2010 firewall where web access rules require authentication, this behavior is expected and by design. It does not indicate an attack of any type on the Forefront TMG firewall or its web proxy service. The root cause for the flood of access denied messages has to do with how the Web Proxy client behaves when accessing resources via an authenticating web proxy like the Forefront TMG 2010 firewall. When a Web Proxy client sends its initial request for a resource it will always attempt to do so anonymously. Only when prompted for authentication by the firewall will the web proxy client provide the credentials of the logged on user.
Consider a scenario where Forefront TMG is configured to only allow authenticated users to access the Internet. The firewall policy might look something like this:

Below is a network trace taken from a client attempting to access http://www.bing.com/ through a TMG firewall as configured above.

We can see that the first three packets of the trace are the TCP three-way handshake taking place between the web proxy client and the Forefront TMG firewall. Once a connection to the web proxy listener has been established, in packet 8 the client sends an HTTP GET request for http://www.bing.com/. In packet 13 you’ll see that the Forefront TMG firewall denied the request and replied with an HTTP 407 response, indicating that proxy authentication was required. This was done because the Forefront TMG firewall did not have any access rules which would allow the anonymous request. It did, however, have access rules that might apply to this request, depending on who the user is. This response also includes which authentication methods the web proxy listener is configured to accept.

In packet 15 the web proxy client again submits its HTTP GET request for http://www.bing.com/, this time indicating that it would like to use the NTLM Secure Service Provider (SSP). In packet 16 the Forefront TMG web proxy denies the request yet again and replies with another HTTP 407 response, this time including the NTLM challenge. In packet 17 the client submits an HTTP GET request for http://www.bing.com/ and supplies the credentials in the form of an NTLM response.
As you can see, each time a web proxy client requests a resource through a Forefront TMG firewall that requires NTLM authentication the client is actually denied twice during the transaction before being successfully authenticated and allowed access. If this sounds like a lot of overhead for authenticated proxy traffic, you are right. Denying each request twice consumes additional resources on the Forefront TMG firewall and introduces some latency for clients as well. In addition, the burden of authenticating the user is placed on the TMG firewall when using NTLM, as the firewall itself must contact a domain controller to authenticate the user. You can reduce the authentication load on the Forefront TMG firewall considerably by enabling Kerberos authentication. When the Forefront TMG firewall is configured to use Kerberos there is only a single denied request and HTTP 407 response. The client must then contact a domain controller and obtain a Kerberos ticket to present to the TMG firewall to gain access to the resource. Information on how to configure Microsoft ISA Server and Forefront TMG 2010 to use Kerberos authentication can be found here.
Additional information…
HTTP response codes – http://www.w3.org/Protocols/rfc2616/rfc2616-sec10.html
NTLM challenge/response – http://en.wikipedia.org/wiki/NTLM
Forefront TMG 2010 Network Inspection System and Custom Protocols
An intrusion detection and prevention system (IDS/IPS) is an essential component of a modern secure web gateway. The Network Inspection System (NIS) in Forefront Threat Management Gateway (TMG) 2010 is a unique implementation of IDS/IPS. NIS is focused specifically on detecting and preventing attacks on Microsoft operating systems and applications. NIS uses signatures that are developed by the Microsoft Malware Protection Center (MMPC) and are distributed through Windows Update or WSUS.
NIS in Forefront TMG 2010 provides protection by performing low-level network protocol inspection. Each packet is analyzed for protocol state, message structure, and message content. When a packet is received, NIS will inspect it only after the firewall policy has allowed it, and only after any associated web or application filters have processed it.
There is one caveat, however. A custom protocol is not subject to NIS inspection by the Forefront TMG firewall unless it is associated with a standard protocol. Often a Forefront TMG firewall administrator will create a custom protocol for a standard protocol that uses a non-standard port. One of the most common protocols to be configured to use non-standard ports is the HTTP protocol. For example, if an administrator defines a custom protocol to support a web-based application that uses the non-standard TCP port 62112, by default NIS will not inspect this traffic even though the communication is HTTP, a protocol which NIS normally inspects when it takes place over the standard TCP port 80.
To apply Forefront TMG NIS inspection to a custom protocol it must first be associated with a standard protocol. In our example we’re using HTTP over a non-standard port, so we need to associate our custom protocol with the Web Proxy Filter.

Next, associate the custom protocol with a standard protocol definition, in this case HTTP Proxy.

Once complete, Forefront TMG NIS inspection will be applied to the custom protocol and policy will be enforced according to the current NIS configuration.
Forefront TMG NIS additional information:
Security Configuration Wizard for Forefront TMG 2010 and Windows Server 2008 R2 SP1
Security hardening and attack surface reduction is an important step in preparing a Forefront TMG 2010 firewall. To accomplish this task, the tool of choice is the Security Configuration Wizard (SCW). In one of my ISAserver.org articles I demonstrated how to use this tool to properly configure the underlying operating system to support the Forefront TMG 2010 firewall role. Since the native Windows SCW does not include support for the Forefront TMG role, the TMGRolesForSCW.exe utility included in the Forefront TMG Tools and SDK is required. This tool was released prior to service pack 1 for Windows Server 2008 R2 and does not include a template that works correctly out of the box. When you attempt to register the Windows Server 2008 R2 template on a system with SP1 installed you will receive the following error:
Command completed with error.
The parameter is incorrect.
Please check log file(s) under the following directory:
%windir%\security\msscw\logs

To resolve this issue, create a copy of the template file SCW_TMG_W2K8R2_SP0.xml and name it SCW_TMG_W2K8R2_SP1.xml. Open this file with any text editor and navigate to the SCWKBRegistrationInfo node (line 2). Change the value of ServicePackMajorVersion from “0” to “1” and save the file. Register the template using the following command:
scwcmd register /kbname:TMG /kbfile:scw_tmg_w2k8r2_sp1.xml
Continue using the SCW to configure and apply a security template to your TMG firewall following the instructions in my ISAserver.org article.
Forefront TMG 2010 Web Proxy Auto Detect Fails
Recently I received a call from a customer who was trying to resolve an issue where all web proxy clients that were configured to use Web Proxy Auto Discovery (WPAD) with DNS suddenly stopped working. We began troubleshooting by confirming that the hostname WPAD resolved to the internal IP address of the Forefront TMG firewall, which it did correctly. Next we used a telnet client to confirm that the TMG firewall was listening on TCP port 80 (used by TMG for DNS WPAD clients) and indeed it was responsive. A scan of the event logs on the firewall turned up the following warning message:
“The Web Proxy filter failed to bind its socket to 172.16.1.253 port 80. This may have been caused by another service that is already using the same port or by a network adapter that is not functional. To resolve this issue, restart the Microsoft Firewall service. The error code specified in the data area of the event properties indicates the cause of the failure.”

Something was listening on TCP port 80, so we opened a command prompt and entered the following command in order to determine which process was listening on this port:
netstat –ano | findstr :80

Netstat was reporting that TCP port 80 was in a listening state and bound to the IP address 172.16.1.253. The process using this port was the System process (PID 4). This is unexpected, because the Forefront TMG web proxy service (wspsrv.exe) should be bound and listening on this port. Clearly this was a web service hijacking this port, so to find out more we entered the following command at a command prompt:
netsh http show servicestate
The output of this command revealed a valuable clue. Notice the registered URL below…

HTTP://172.16.1.253:80:172.16.1.253/REPORTSERVER_ISARS/
As it turns out, this customer had attempted to change the SQL Reporting Services Web Service URL. By assigning the Forefront TMG firewall’s internal IP address and changing the port to 80 in the Reporting Service Configuration Manager, this caused a conflict with the Forefront TMG web proxy filter, which requires TCP port 80 to provide WPAD for DNS.

To resolve the issue, the administrator chose a TCP port other than 80 and restarted the system.
Preparing Forefront TMG 2010 for Enterprise Workgroup Deployment
Deploying Forefront Threat Management Gateway (TMG) 2010 in a workgroup (non-domain joined) enterprise array configuration can present a significant challenge to many administrators. This post isn’t meant to be a comprehensive TMG Enterprise Management Server (EMS) deployment guide, but I would like to share with you a few important tips that will hopefully make the process of creating an EMS-managed array a little easier.
Before Installing EMS
IP Addressing – Make certain that all basic IP connectivity is verified before installing any Forefront TMG 2010 services.
Name Resolution – Confirm that name resolution is working properly and that hostnames are being resolved to the correct IP addresses. Be sure that these IP addresses are assigned to the Internal network interface of the EMS and each array member.
Certificates – The EMS will require a machine certificate, and each array member should trust the Certificate Authority (CA) that issued this certificate. It is recommended that this certificate be issued by your internal private CA and not a public third-party CA. The certificate should be for server authentication and the common name on the certificate should be the FQDN of the host it is to be installed on. Be sure to install the root certificate and any intermediate certificates for the CA on the EMS and each array member. Make certain the certificate is issued with the option for the private key to be exportable.
Local Accounts – Identical (mirrored) local accounts should be configured on the EMS and each array member and be granted administrative rights for the Forefront TMG 2010 Enterprise.
After Installing EMS
Before joining a TMG firewall to an array, you can perform some preliminary tests to determine if certificate authentication between hosts is working correctly. To do this, open a PowerShell command window and enter the following commands:
import-module servermanager
add-windowsfeature rsat-adlds
Once complete, click Start | Run and enter ldp.exe. From the drop-down menu choose Connection, and then Connect…. For the server, enter the fully-qualified domain name (FQDN) of the EMS, specify port 2172, and then select the option to use SSL.

If certificate authentication is working correctly you will connect to the RootDSE. If it is not configured correctly you will receive a connection error.

To determine if user authentication is working correctly, select Connection from the drop-down menu and then Bind…. If you are currently logged on with the local mirrored account, select the option to Bind as currently logged on user, otherwise select Bind with credentials and enter the user and password of the mirrored account (leave the domain blank).

If configured correctly you will receive notification that you have been authenticated. If not, you will be notified that the logon attempt failed.

Once you’ve completed these steps you can proceed with configuring the TMG firewall to join the array. Be sure to specify the name of the EMS in exactly the same format as the certificate common name (preferably using the FQDN ).
Connect


