Archive
PAL v2.3.3 Now with Forefront UAG 2010 Support
Recently the Performance Analysis of Logs (PAL) tool was updated and now includes a threshold file for Forefront UAG 2010. PAL is an essential utility that can make troubleshooting performance issues or capacity planning dramatically easier. I’ve written about using PAL on Forefront TMG 2010 in the past, and using PAL with Forefront UAG 2010 will be very similar. You can download the latest release of PAL at pal.codeplex.com.
Disable Logging on System Policy Rules in Forefront TMG 2010
I’ve written a number of articles on improving system performance and logging optimization over the years. As I’ve mentioned previously, this involves the security administrator reviewing each access rule and deciding if the traffic is interesting enough to require logging. If it is not, to improve performance and reduce log pollution it is advisable to disable logging for the access rule in question.
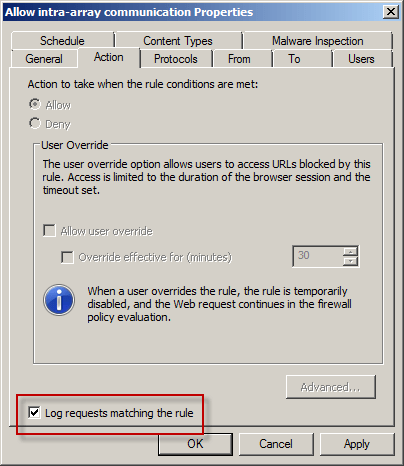
However, when attempting to make this change to a system policy rule you will encounter the following error:
The changes cannot be saved.

Error: 0xc0040334

This property cannot be modified for the predefined item.

The error occurred on object <policy rule name> of class
‘Policy Rule’ in the scope of array .
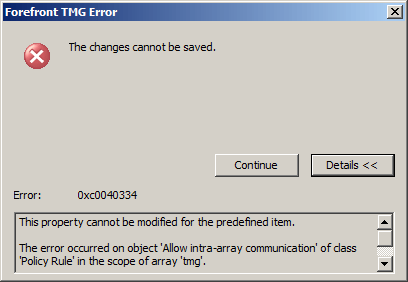
Unfortunately the system policy editor provides no facility to make this change in the GUI. To work around this limitation you can use COM to disable logging on system policy rules programmatically using the following script. In this example I’ve chosen to disable logging on the Allow intra-array communication system policy rule.
Option Explicit

Dim Root, Array, Rule

Set Root = CreateObject("FPC.Root")

Set Array = Root.GetContainingArray()
Set Rule = Array.SystemPolicy.PolicyRules.Item("Allow intra-array communication")

Rule.EnableLogging = False
Rule.Save

WScript.Echo “Done!”

Set Rule = Nothing
Set Array = Nothing
Set Root = Nothing
Note: To see this change reflected in the management console, hit F5 to refresh or close and reopen the console.
If you wish to disable logging for all system policy rules, alter the script to use a For Each Next construct as follows:
Set Rules = Array.SystemPolicy.PolicyRules

For Each Rule in Rules
Rule.EnableLogging = False
Next
Access to the Web Proxy Filter on Forefront TMG 2010 is Denied
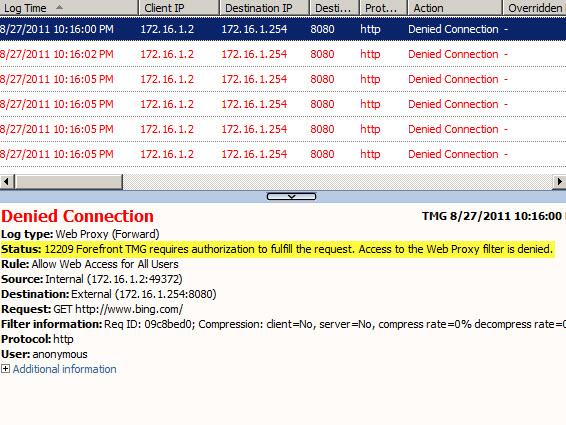
Frequently I am asked to review Forefront TMG 2010 firewall logs for suspicious behavior. Often times a security administrator will express concerns about many instances of denied requests by clients attempting to connect to Forefront TMG’s web proxy service. On busy TMG firewalls there may be hundreds or even thousands of instances where the following access denied record appears in the Web Proxy logs:
Status: 12209 Forefront TMG requires authorization to fulfill the request.
Access to the Web Proxy filter is denied.
On a Forefront TMG 2010 firewall where web access rules require authentication, this behavior is expected and by design. It does not indicate an attack of any type on the Forefront TMG firewall or its web proxy service. The root cause for the flood of access denied messages has to do with how the Web Proxy client behaves when accessing resources via an authenticating web proxy like the Forefront TMG 2010 firewall. When a Web Proxy client sends its initial request for a resource it will always attempt to do so anonymously. Only when prompted for authentication by the firewall will the web proxy client provide the credentials of the logged on user.
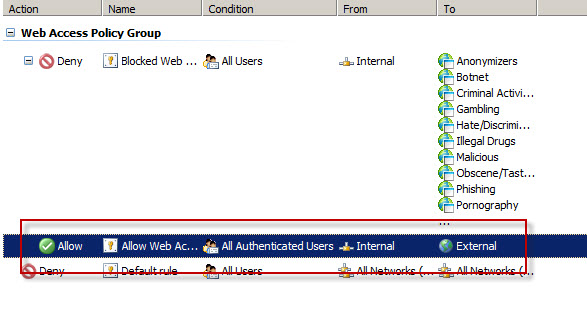
Consider a scenario where Forefront TMG is configured to only allow authenticated users to access the Internet. The firewall policy might look something like this:
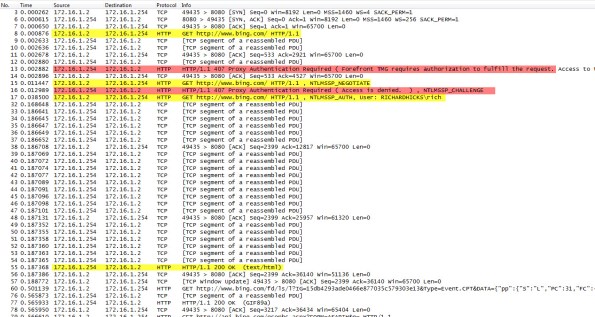
Below is a network trace taken from a client attempting to access http://www.bing.com/ through a TMG firewall as configured above.
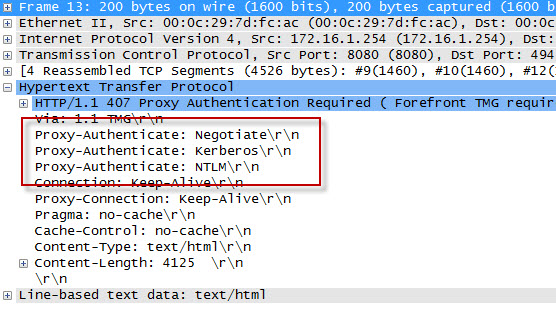
We can see that the first three packets of the trace are the TCP three-way handshake taking place between the web proxy client and the Forefront TMG firewall. Once a connection to the web proxy listener has been established, in packet 8 the client sends an HTTP GET request for http://www.bing.com/. In packet 13 you’ll see that the Forefront TMG firewall denied the request and replied with an HTTP 407 response, indicating that proxy authentication was required. This was done because the Forefront TMG firewall did not have any access rules which would allow the anonymous request. It did, however, have access rules that might apply to this request, depending on who the user is. This response also includes which authentication methods the web proxy listener is configured to accept.
In packet 15 the web proxy client again submits its HTTP GET request for http://www.bing.com/, this time indicating that it would like to use the NTLM Secure Service Provider (SSP). In packet 16 the Forefront TMG web proxy denies the request yet again and replies with another HTTP 407 response, this time including the NTLM challenge. In packet 17 the client submits an HTTP GET request for http://www.bing.com/ and supplies the credentials in the form of an NTLM response.
As you can see, each time a web proxy client requests a resource through a Forefront TMG firewall that requires NTLM authentication the client is actually denied twice during the transaction before being successfully authenticated and allowed access. If this sounds like a lot of overhead for authenticated proxy traffic, you are right. Denying each request twice consumes additional resources on the Forefront TMG firewall and introduces some latency for clients as well. In addition, the burden of authenticating the user is placed on the TMG firewall when using NTLM, as the firewall itself must contact a domain controller to authenticate the user. You can reduce the authentication load on the Forefront TMG firewall considerably by enabling Kerberos authentication. When the Forefront TMG firewall is configured to use Kerberos there is only a single denied request and HTTP 407 response. The client must then contact a domain controller and obtain a Kerberos ticket to present to the TMG firewall to gain access to the resource. Information on how to configure Microsoft ISA Server and Forefront TMG 2010 to use Kerberos authentication can be found here.
Additional information…
HTTP response codes – http://www.w3.org/Protocols/rfc2616/rfc2616-sec10.html
NTLM challenge/response – http://en.wikipedia.org/wiki/NTLM
Forefront TMG Performance Troubleshooting with PAL v2.x Part 2 – Data Analysis and Reporting
In the first part of this two-part series we used PAL and Performance Monitor to collect data. In this second part I’ll demonstrate how to use PAL to analyze the data and generate a report.
Analyzing the Data
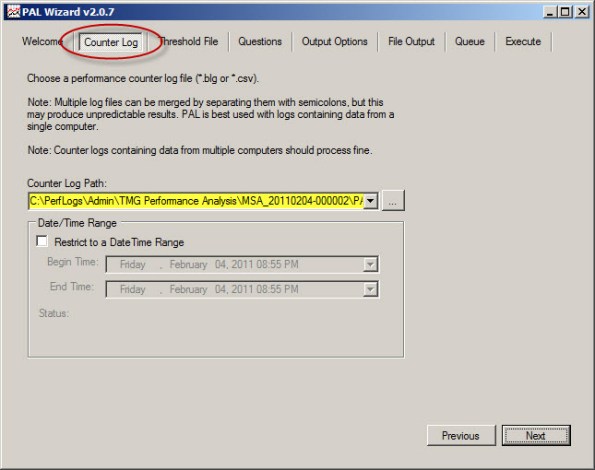
Once you’ve collected the necessary log data you are ready to analyze it using PAL. To begin, open the PAL tool, click Next or select the Counter Log tab, then choose the path to the log file collected using Performance Monitor.
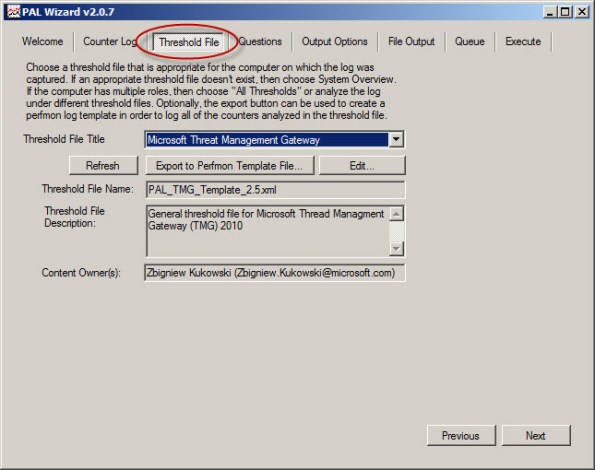
Select Microsoft Forefront Threat Management Gateway for the threshold file and choose Next.
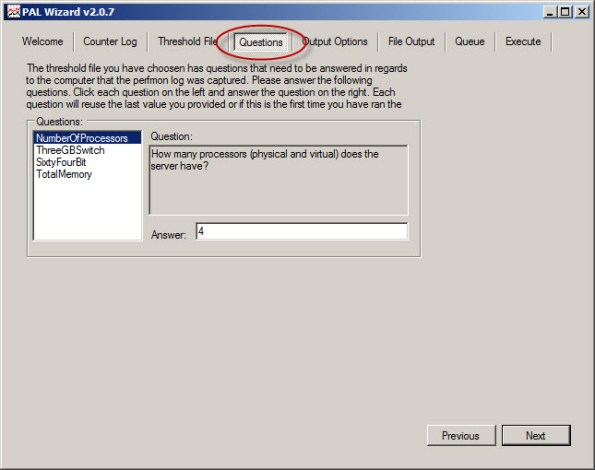
To accurately analyze the data, PAL needs to know specific details about the system where the log data was collected. Highlight and answer each question and choose Next.
Accept the default settings for Analysis Interval and All Counter Stats.
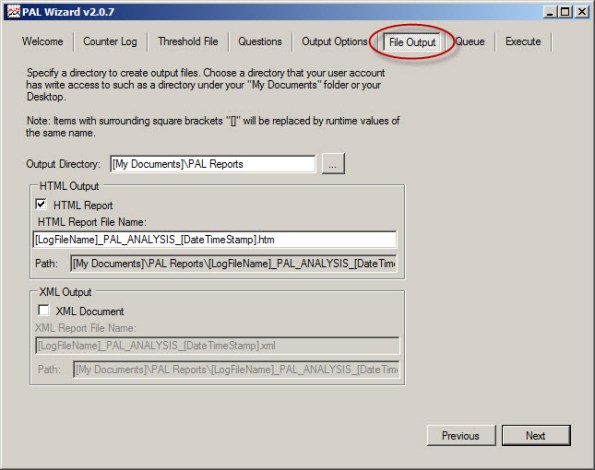
By default, PAL generates reports in HTML format and places them in the My Documents\PAL Reports folder. Here you can change the default file location and also select the option to generate reports in XML format.
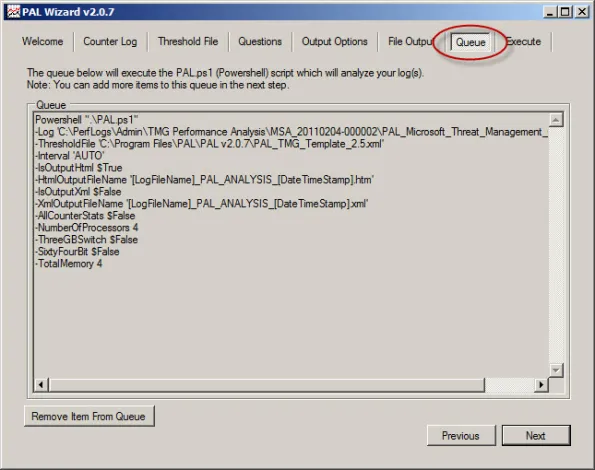
Behind the scenes PAL leverages a complex PowerShell script to perform analysis and generate reports.
To perform the analysis and generate a report, click Finish. Optionally you can add the analysis job to the job queue or execute the analysis and restart the wizard with the same settings. You can also select the option to execute as a low priority process.
PAL begins analyzing the log data and once complete it generates a report in the format specified. You can view a sample report here.
The report is very detailed and includes alerts when a particular counter exceeds a predetermined threshold. The alerts are color coded to easily identify when a threshold has been exceeded. The report also includes a brief explanation of each counter, a graphical chart of the data analyzed, and statistical data relating to the counter.
PAL is a wonderful tool that greatly simplifies the process of analyzing Performance Monitor data. It is not, however, a magic wand that will solve all of your performance issues automatically. Although the tool provides a wealth of information in a clear and concise format, it is still up to the administrator to understand the data and ultimately determine how best to resolve the issue. PAL just makes that task much easier.
Forefront TMG Performance Troubleshooting with PAL v2.x Part 1 – Data Collection
Forefront TMG Performance Troubleshooting with PAL v2.x Part 2 – Data Analysis and Reporting
Forefront TMG Performance Troubleshooting with PAL v2.x Part 1 – Data Collection
Troubleshooting performance issues on any system, especially a Forefront Threat Management Gateway (TMG) 2010 firewall can be a significant challenge for many administrators. The primary tool used for this task is the Windows Performance Monitor. This tool allows the administrator to monitor virtually every aspect of the operating system, applications, and hardware. However, deciding which objects and counters to monitor and how to interpret the data can be difficult.
That’s where Performance Analysis of Logs (PAL) comes in. Created by Microsoft Premiere Field Engineer (PFE) Clint Huffman, this free tool automates the analysis of logged data collected using Performance Monitor. PAL uses templates along with user input to analyze and report on the collected log information. It eliminates guesswork by highlighting counters that exceed predefined thresholds. PAL has been around for many years, but until recently has lacked support for Forefront TMG. Thanks to the effort and hard work by some Forefront PFE’s and CSS engineers, the recent release of PAL v2.0.7 now fully supports Forefront TMG.
PAL can be found at http://pal.codeplex.com/. It is available for 32- and 64-bit systems, and requires that Microsoft .NET Framework 3.5 SP1, Microsoft Chart Controls for .NET Framework 3.5, and PowerShell v2.0 be installed.
In this first part of a two-part series we’ll first look at how to use PAL to configure Performance Monitor to collect the necessary data. In the second part will use PAL to analyze the data and generate a report.
Collecting Data
Enabling private Performance Monitor counters is required to fully analyze performance on the Forefront TMG firewall. Enabling private Performance Monitor counters is accomplished be creating the following registry key on the Forefront TMG firewall:
HKLM\SOFTWARE\Microsoft\RAT\Stingray\Debug\FWSRV
"FWS_PRIVATE_PERFORMANCE_COUNTERS"=dword:00000001
Download .reg file here.
To begin collecting performance data on the Forefront TMG firewall, open the PAL tool and select the Threshold File tab, then click the drop-down box and choose Microsoft Threat Management Gateway.
Click Export to Perfmon Template File… and save the file.
On the TMG firewall, open the Performance Monitor, expand Data Collector Sets, and then right-click User Defined and choose New -> Data Collector Set.
Give the new data collector set a descriptive name, select the option to Create from a template, then click Next.
When the wizard prompts for which template to use, click Browse…, then select the PAL template file exported earlier.
Specify the folder where the logged data will be saved and click Finish.
Once complete, the new data collector set will appear. If you right-click the new collector set and choose Properties… you will see that it contains all of the necessary Performance Monitor objects and counters required to perform an in-depth performance analysis of the Forefront TMG firewall. Here you can also change parameters such as the log format (binary log format is recommend, however) and sample interval. You can also change file parameters such as the log file name, the file name format, and the logging mode (overwrite, append, or circular).
To start collecting data, right-click the data collector set and choose Start. Once the capture has started, you can right-click and select Stop to stop the capture.
You can also schedule data collection by right-clicking the data collector set and choosing Properties, clicking the Schedule tab, and then clicking Add.
You can also specify a stop condition that will cease data collection based on any number of different parameters including duration and size of the log file.
In the second part of this two-part series we’ll outline how to use PAL to analyze and generate reports of the Performance Monitor data.
Forefront TMG Performance Troubleshooting with PAL v2.x Part 1 – Data Collection
Forefront TMG Performance Troubleshooting with PAL v2.x Part 2 – Data Analysis and Reporting
