Archive
Forefront TMG Performance Troubleshooting with PAL v2.x Part 2 – Data Analysis and Reporting
In the first part of this two-part series we used PAL and Performance Monitor to collect data. In this second part I’ll demonstrate how to use PAL to analyze the data and generate a report.
Analyzing the Data
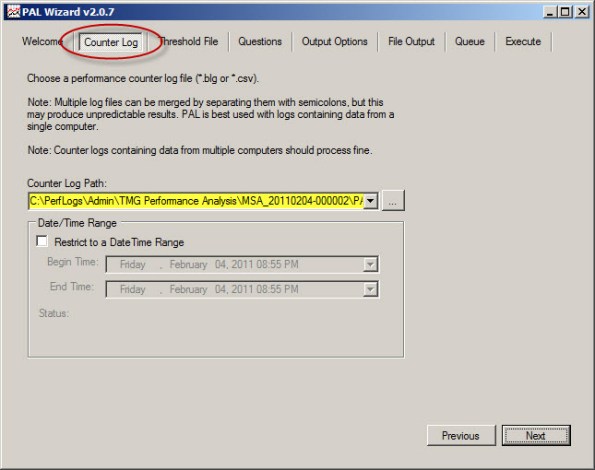
Once you’ve collected the necessary log data you are ready to analyze it using PAL. To begin, open the PAL tool, click Next or select the Counter Log tab, then choose the path to the log file collected using Performance Monitor.
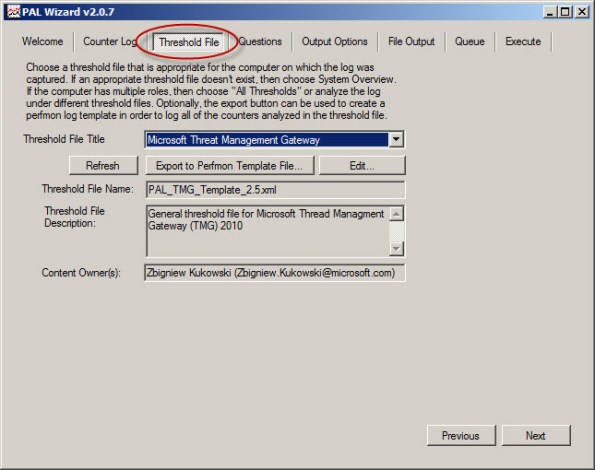
Select Microsoft Forefront Threat Management Gateway for the threshold file and choose Next.
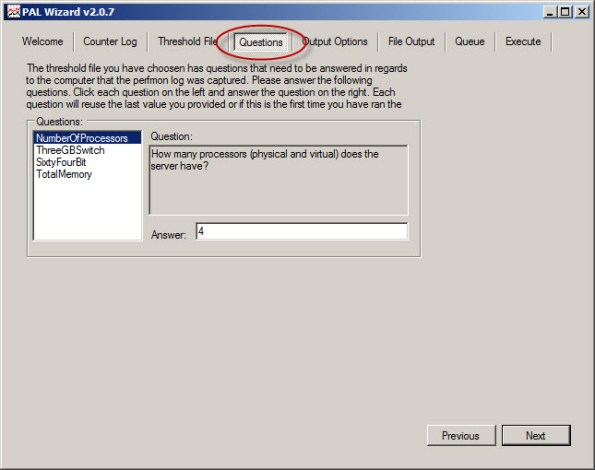
To accurately analyze the data, PAL needs to know specific details about the system where the log data was collected. Highlight and answer each question and choose Next.
Accept the default settings for Analysis Interval and All Counter Stats.
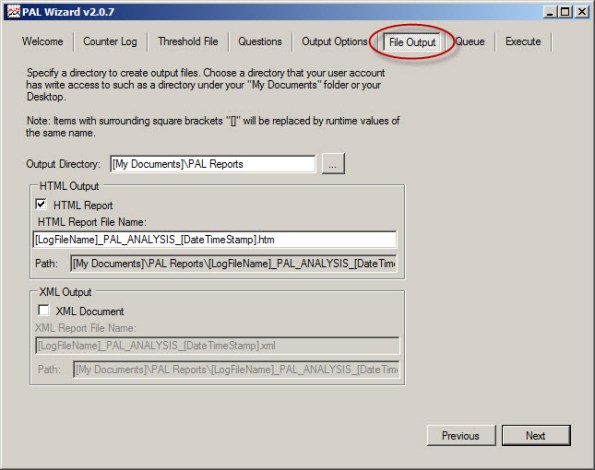
By default, PAL generates reports in HTML format and places them in the My Documents\PAL Reports folder. Here you can change the default file location and also select the option to generate reports in XML format.
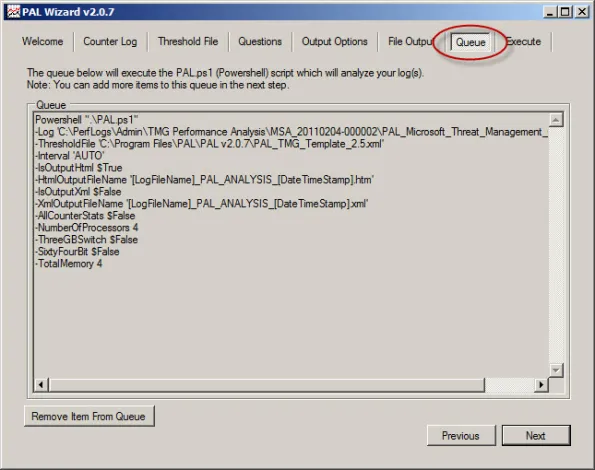
Behind the scenes PAL leverages a complex PowerShell script to perform analysis and generate reports.
To perform the analysis and generate a report, click Finish. Optionally you can add the analysis job to the job queue or execute the analysis and restart the wizard with the same settings. You can also select the option to execute as a low priority process.
PAL begins analyzing the log data and once complete it generates a report in the format specified. You can view a sample report here.
The report is very detailed and includes alerts when a particular counter exceeds a predetermined threshold. The alerts are color coded to easily identify when a threshold has been exceeded. The report also includes a brief explanation of each counter, a graphical chart of the data analyzed, and statistical data relating to the counter.
PAL is a wonderful tool that greatly simplifies the process of analyzing Performance Monitor data. It is not, however, a magic wand that will solve all of your performance issues automatically. Although the tool provides a wealth of information in a clear and concise format, it is still up to the administrator to understand the data and ultimately determine how best to resolve the issue. PAL just makes that task much easier.
Forefront TMG Performance Troubleshooting with PAL v2.x Part 1 – Data Collection
Forefront TMG Performance Troubleshooting with PAL v2.x Part 2 – Data Analysis and Reporting
Forefront TMG Performance Troubleshooting with PAL v2.x Part 1 – Data Collection
Troubleshooting performance issues on any system, especially a Forefront Threat Management Gateway (TMG) 2010 firewall can be a significant challenge for many administrators. The primary tool used for this task is the Windows Performance Monitor. This tool allows the administrator to monitor virtually every aspect of the operating system, applications, and hardware. However, deciding which objects and counters to monitor and how to interpret the data can be difficult.
That’s where Performance Analysis of Logs (PAL) comes in. Created by Microsoft Premiere Field Engineer (PFE) Clint Huffman, this free tool automates the analysis of logged data collected using Performance Monitor. PAL uses templates along with user input to analyze and report on the collected log information. It eliminates guesswork by highlighting counters that exceed predefined thresholds. PAL has been around for many years, but until recently has lacked support for Forefront TMG. Thanks to the effort and hard work by some Forefront PFE’s and CSS engineers, the recent release of PAL v2.0.7 now fully supports Forefront TMG.
PAL can be found at http://pal.codeplex.com/. It is available for 32- and 64-bit systems, and requires that Microsoft .NET Framework 3.5 SP1, Microsoft Chart Controls for .NET Framework 3.5, and PowerShell v2.0 be installed.
In this first part of a two-part series we’ll first look at how to use PAL to configure Performance Monitor to collect the necessary data. In the second part will use PAL to analyze the data and generate a report.
Collecting Data
Enabling private Performance Monitor counters is required to fully analyze performance on the Forefront TMG firewall. Enabling private Performance Monitor counters is accomplished be creating the following registry key on the Forefront TMG firewall:
HKLM\SOFTWARE\Microsoft\RAT\Stingray\Debug\FWSRV
"FWS_PRIVATE_PERFORMANCE_COUNTERS"=dword:00000001
Download .reg file here.
To begin collecting performance data on the Forefront TMG firewall, open the PAL tool and select the Threshold File tab, then click the drop-down box and choose Microsoft Threat Management Gateway.
Click Export to Perfmon Template File… and save the file.
On the TMG firewall, open the Performance Monitor, expand Data Collector Sets, and then right-click User Defined and choose New -> Data Collector Set.
Give the new data collector set a descriptive name, select the option to Create from a template, then click Next.
When the wizard prompts for which template to use, click Browse…, then select the PAL template file exported earlier.
Specify the folder where the logged data will be saved and click Finish.
Once complete, the new data collector set will appear. If you right-click the new collector set and choose Properties… you will see that it contains all of the necessary Performance Monitor objects and counters required to perform an in-depth performance analysis of the Forefront TMG firewall. Here you can also change parameters such as the log format (binary log format is recommend, however) and sample interval. You can also change file parameters such as the log file name, the file name format, and the logging mode (overwrite, append, or circular).
To start collecting data, right-click the data collector set and choose Start. Once the capture has started, you can right-click and select Stop to stop the capture.
You can also schedule data collection by right-clicking the data collector set and choosing Properties, clicking the Schedule tab, and then clicking Add.
You can also specify a stop condition that will cease data collection based on any number of different parameters including duration and size of the log file.
In the second part of this two-part series we’ll outline how to use PAL to analyze and generate reports of the Performance Monitor data.
Forefront TMG Performance Troubleshooting with PAL v2.x Part 1 – Data Collection
Forefront TMG Performance Troubleshooting with PAL v2.x Part 2 – Data Analysis and Reporting
A Word about Network Interface Port Speed and Duplex Settings
When configuring network interface settings on a Forefront Threat Management Gateway (TMG) 2010 firewall, I strongly recommend that the port speed and duplex settings on all active network interfaces be manually configured. Although autonegotiation is typically enabled by default, and in most cases works without issue, I prefer to eliminate any possibility that a slower link speed or incorrect duplex setting is negotiated in error by configuring these settings explicitly.
Some believe you can configure one side of a link (either the host or the switch) manually and leave the other side set to autonegotiate. The theory is that the host set to autonegotiate will determine what settings the other side has configured and automatically choose those. This is not completely true and doesn’t work as expected. When one side of a link is set for autonegotiation and the other side is not (or doesn’t support it), a process called parallel detection takes place whereby the device that is configured to autonegotiate can determine the port speed of the other device, but it cannot determine the duplex settings and defaults to half duplex. Often this results in a duplex mismatch, which will cause extremely poor performance.
So, when configuring port speed and duplex settings, always remember that BOTH sides of the link should be configured identically. That is, if the switch is configured for 100Mbps/full duplex operation, the network interface on the TMG firewall should be configured the same. On some systems (mostly older ones), when attempting to change these settings, you might notice that there is no option to enable 1000Mbps (gigabit) at full duplex operation. The only available option is autonegotiate 1000Mbps.
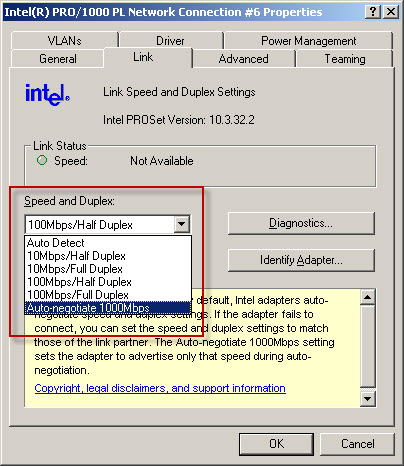
Why is there no option to select 1000Mbps and full duplex? Because the designers of the 1000BASE-T specification (IEEE 802.3ab) made duplex autonegotiation mandatory when operating at 1000Mbps port speed over copper cabling. For this reason some network interface management software may limit your choices and not allow you to select this option. In my experience it appears that adherence to this mandate has been relaxed as most newer systems I have worked with now give you the option of configuring 1000Mbps and full duplex operation with copper cabling. If you have an older system and don’t have the option to specify 1000Mbps/full duplex on the network interface, I would recommend updating your network interface device drivers. If you still don’t have the option to specify 1000Mbps/full duplex you may need to replace the network interface card itself.
Fwengmon.exe and Forefront Threat Management Gateway (TMG) 2010
For engineers performing advanced troubleshooting on TMG, you have likely noticed that fwengmon.exe, a utility that you used with previous versions of ISA, no longer functions with TMG.
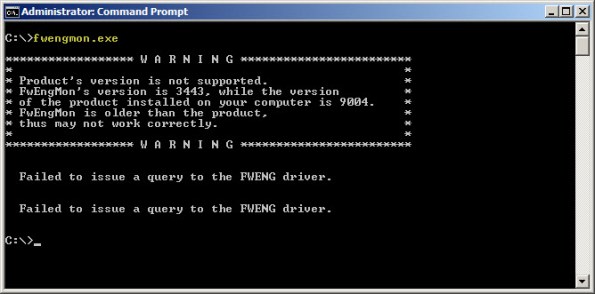
Not to worry! This detailed information is readily accessible using netsh.exe in the tmg context. The following is a list of common commands and their fwengmon.exe equivalents (where applicable):
To view creation objects, active sessions, NLB hook rules, NLB server assigned ranges, and dynamic and persistent allowed ranges:
netsh tmg show all
To view connections only (fwengmon.exe /session or /s):
netsh tmg show connections
To view detailed information about a specific connection (fwengmon.exe /s <ID>):
netsh tmg show connections <connection_number>
To view firewall creation elements (fwengmon.exe /creations or /c):
netsh tmg show creations
Note: You can sort and filter output from show connections or show creations by source IP address, source port, destination IP address, destination port, or protocol using the sort and filter parameters (fwengmon.exe /organize or /o, or fwengnmon.exe /filter or /f). You can also limit the number of connections or creations displayed using the display parameter. Type netsh tmg show connections ? or netsh tmg show creations ? for more information.
To show NLB hook rules (fwengmon.exe /querynlb or /n):
netsh tmg show nlbhookrules
To view packets held in kernel mode:
netsh tmg show holdpackets
To view packets held in user mode:
netsh tmg show usermodepackets
To view global firewall engine driver settings:
netsh tmg show global
To specify a temporary address range to exempt from firewall filtering (fwengmon.exe /allow or /a):
netsh tmg add allowedrange <beginning_ip> <ending_ip>
To specify a permanent address range to exempt from firewall filtering (fwengmon.exe /allow or /a):
netsh tmg add allowedrange <beginning_ip> <ending_ip> persistent
Note: netsh tmg add allowedrange allows all traffic to and from hosts within the IP address range specified to bypass stateful firewall inspection completely. It should be used for troubleshooting purposes only.
To delete a temporary address range (fwengmon.exe /noallow):
netsh tmg delete allowedrange id=<id>
To delete a permanent address range (fwengmon.exe /noallow):
netsh tmg delete allowedrange id=<id> persistent
Creating User Mode Process Dumps in Microsoft Forefront Threat Management Gateway (TMG) 2010
In a recent post on his blog, Yuri Diogenes shared with us how to create a manual dump of the wspsrv.exe process in TMG by using the Windows Task Manager. This is tremendously helpful in many situations, but there are scenarios that require more flexibility. For this I use procdump.exe from Sysinternals. To create a dump of a user mode process, enter the following command:
procdump <process>
For example, creating a dump of the wspsrv.exe process would look like this:
procdump wspsrv
This will immediately generate a dump file called wspsrv.dmp.
Procdump provides additional flexibility by allowing you to trigger a dump based on specific thresholds. This is extremely useful when troubleshooting intermittent high CPU utilization issues with TMG. For example, if you wanted to create a dump of the wspsrv.exe process when CPU utilization reaches 90% for more than 5 seconds, enter the following command:
procdump –c 90 –s 5 c:\wspsrv.dmp
When CPU utilization stays at or above 90% for more than 5 seconds, a user mode process dump will be generated and saved in the file c:\wspsrv.dmp. This can be beneficial in situations where high CPU utilization prevents you from using the mouse or typing commands at the command prompt. Automating the task of capturing dumps based on triggers also frees the administrator from having to be at the console when the symptom occurs. Additional command line switches allow you to create multiple dumps, increasing your chances of collecting accurate data for troubleshooting.
Remote Performance Monitoring and Forefront Threat Management Gateway
Recently I encountered an issue when after installing and configuring Microsoft Forefront Threat Management Gateway 2010 (TMG) I was unable to gather performance data remotely. I found this puzzling because I was able to perform other management tasks such as connecting remotely with RDP and the TMG management console without issue. Since my management workstation was a member of the Remote Management Computers network object for the array, I assumed that I would have sufficient access to perform this task. Looking at the access logs revealed something interesting; traffic on TCP port 445 from my management workstation was being denied.
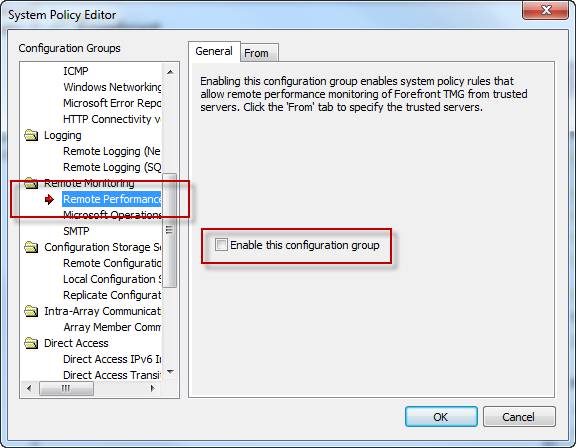
Upon reviewing the system policy I noticed that the Remote Performance Monitoring policy was not enabled. I’ve never had to enable this rule in the past to collect performance data remotely, but I tried enabling it anyway just for good measure.
Enabling this system policy rule did not resolve my issue, and the access log still showed my CIFS traffic being denied. A closer look at this rule shows that only NetBIOS protocols were included, not CIFS.
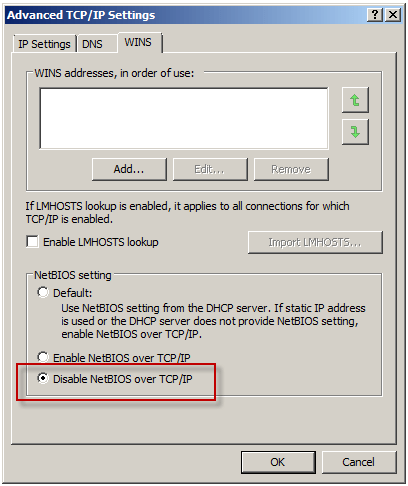
Under normal circumstances, enabling this rule isn’t required if you have the Allow remote management from selected computers using MMC system policy rule enabled (it is enabled by default). What made this situation unique, and ultimately caused the communication failure, was that NetBIOS over TCP/IP was disabled on all network interfaces.
To understand why monitoring performance remotely fails when NetBIOS over TCP/IP is disabled requires an understanding of Server Message Block (SMB) communication. SMB is an application-layer protocol that uses TCP for transport layer communication. In Microsoft operating systems prior to Windows 2000, all SMB communication took place over NetBIOS, which in turn ran on top of TCP/IP using the familiar TCP port 139. Beginning with Windows 2000, SMB runs directly on top of TCP/IP using TCP port 445. In Windows 2000 and later, the default behavior of SMB communication is to attempt to communicate directly over TCP/IP using TCP port 445 first, then if there is no response, an attempt to use NetBIOS over TCP/IP is made using TCP port 139 (provided NetBIOS has not been explicitly disabled). The performance monitor utility (perfmon.exe) communicates in exactly this way. Since NetBIOS over TCP/IP was disabled, communication only takes place over TCP port 445. In the absence of an access rule allowing Microsoft CIFS (TCP) inbound to the local host, the communication fails.
This issue can be resolved in several ways. First, enabling the Allow remote management from selected computers using MMC or the Allow remote performance monitoring of Forefront TMG from trusted servers system policy rule and enabling NetBIOS over TCP/IP on the network interface will resolve the issue. Since disabling NetBIOS over TCP/IP was required by security policy in this case, creating an access rule allowing Microsoft CIFS (TCP) inbound to the local host from Remote Management Workstations was the best choice.
Another option is to enable the Allow access from trusted servers to the local configuration storage server system policy rule, as this rule allows Microsoft CIFS (TCP) protocol inbound to the local host.
This may not be desirable because the rule includes additional protocols that aren’t required for remote performance monitor data collection, and increases exposure of services running on the TMG firewall needlessly.
Microsoft Exchange Server Remote Connectivity Analyzer
My good friend Andy Tang, who works for e92Plus over in the UK, blogged recently about some issues he was having with ActiveSync on IAG. In his post he talks about using a wonderful utility called the Microsoft Exchange Server Remote Connectivity Analyzer. This online tool will allow you to remotely test ActiveSync, Outlook Anywhere (RPC/HTTP), and inbound SMTP. Excellent!
Troubleshooting Basic HTTP Connectivity Using VBScript
As a follow up to my last blog post I wanted to share with you a way to perform basic HTTP connectivity testing using VBScript. Using the GetAllResponseHeaders method of the XMLHTTP object we can easily retrieve and display response headers returned by a web server. The VBScript code looks like this:
Option Explicit
Dim HTTP, Site
Site = InputBox(“Enter site name:”, “Get All Response Headers”)
Set HTTP = WScript.CreateObject(“Microsoft.XMLHTTP”)
Call HTTP.Open(“HEAD”, “http://” & Site, False)
Call HTTP.Send()
MsgBox HTTP.GetAllResponseHeaders(), vbInformation, “Response Headers for ” & Site
Set HTTP = Nothing
Copy the code above to a text file and save it with a .vbs extension. Double-click on the file and you will be prompted to enter a web site to test.
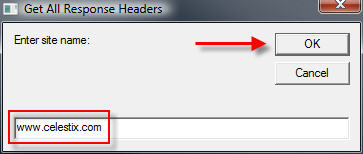
Enter the name of the web site to test and choose ‘Ok’. The script will send a request to the web server and display the response headers returned.
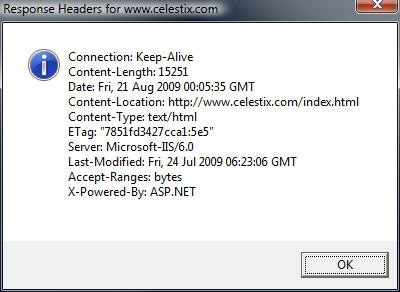
Admittedly this code is very rudimentary, but it is a simple and effective way to troubleshoot HTTP connectivity issues. If you are interested in something similar that has many more features, including the ability to use specific HTTP commands, perform logging, use a proxy server, specify a USER AGENT string and much more, visit Jim Harrison’s ISATools.org and download his very powerful HTTP_TEST VBScript.
Troubleshooting Basic HTTP Connectivity Using A Telnet Client
In my last blog post I demonstrated how to use the Windows telnet client to perform basic network connectivity troubleshooting. In this post I will demonstrate how to use the telnet client to interactively perform basic HTTP troubleshooting.
Note: This post assumes that you have a fundamental understanding of the HTTP protocol. If you are not familiar with HTTP and would like to learn more, there are some excellent books on the subject available. Two books that I recommend are HTTP – The Definitive Guide and the HTTP Pocket Reference, both from O’Reilly Books.
To begin, open a command prompt and enter the command telnet. This will bring up a telnet command prompt.
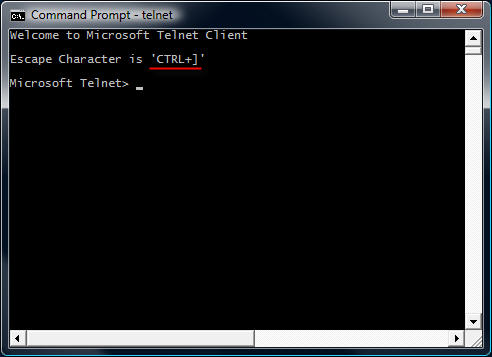
Notice that the escape character is CTRL+]. We’ll need to know this later. Next, enter the command set localecho. This command allows us see the text that we type in the command window.
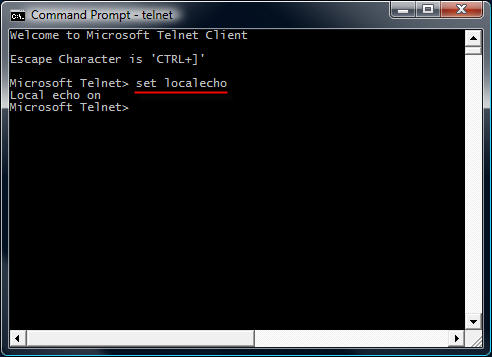
To establish a connection to a web server on the default port, the command syntax is open <IP address, FQDN, or hostname> <port>.
For example…
open intranet.celestix.net 80
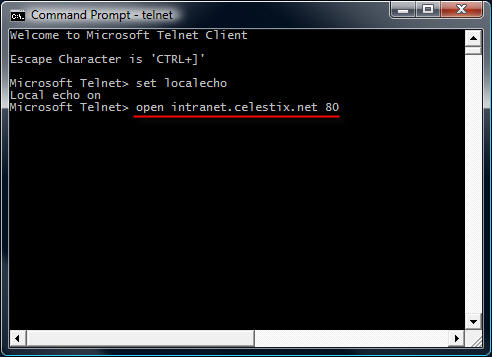
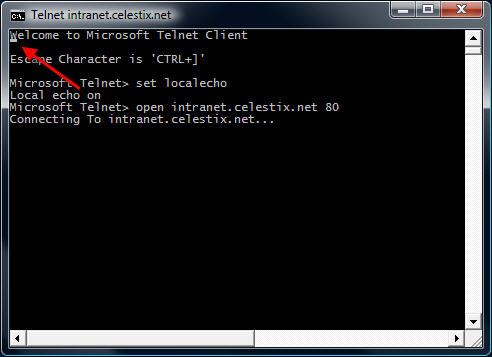
After you enter the open command and hit enter, it is not readily apparent that a connection has been made to the web server. That’s because the cursor immediately jumps to the upper left corner of the command window.
Before entering commands, hit the enter key a few times to bring the cursor to a clear area in the window.
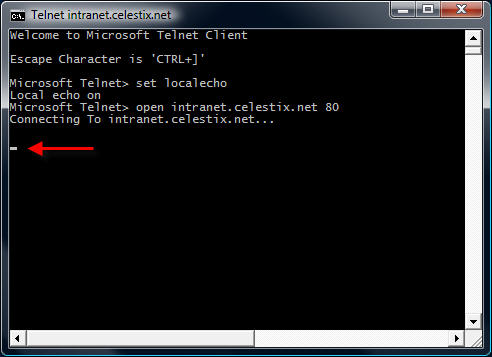
Now that we have established a connection, we are ready to issue some basic HTTP commands to the web server. Let’s begin by retrieving the default web page for the site intranet.celestix.net. Although a full-featured HTTP client will send many request headers to a web server to retrieve content, the RFC specifies that only the HOST header is mandatory for HTTP 1.1. First we will send a GET command requesting the default page, then we will provide the HOST header to let the web server know which web site we are requesting content from (this is required because the web server may be hosting multiple web sites using the same IP address).
To retrieve the default page from intranet.celestix.net, enter the following commands:
GET / HTTP/1.1
HOST: intranet.celestix.net
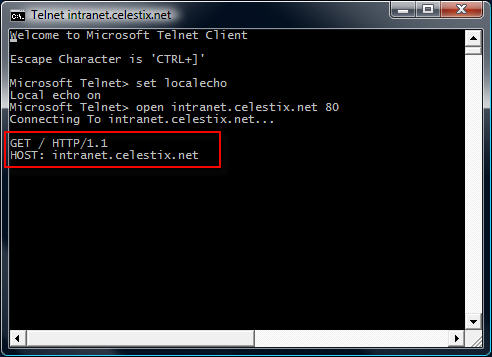
These commands are case sensitive! Be sure to enter them exactly as shown above. After entering the HOST information, hit enter twice to send the commands to the web server. If successful, the web server will respond with the requested content.
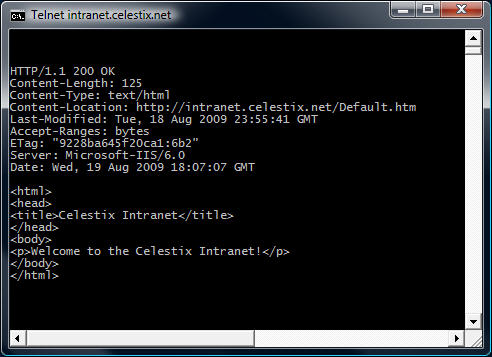
Enter the escape command sequence CTRL+] to return to the telnet command prompt.
Additional Examples
Instead of retrieving the content of the web page, we could request that the web server send response headers only. This can be accomplished by entering the following commands:
HEAD / HTTP/1.1
HOST: intranet.celestix.net

If successful, the web server will send only the response headers and not the content of the web page itself.
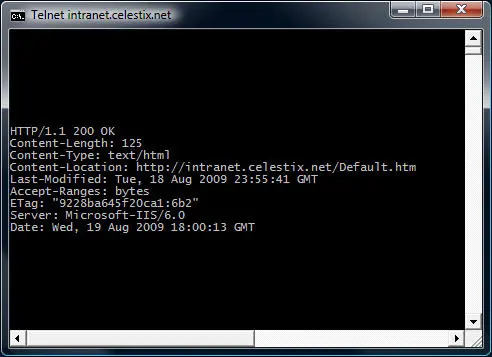
Although somewhat useful in troubleshooting basic HTTP communication, the telnet client isn’t the best tool to use. As you will quickly see, the telnet client will not allow you to backspace if you make a typo entering a command. The advantage of using the telnet client is that it is installed on most Windows operating systems by default. Thankfully, a much more robust and feature rich tool is available from Microsoft. WFetch is a GUI utility that allows you to issue many different commands to the web server and includes support for multiple authentication methods. It includes the flexibility to manipulate headers and provides the ability to direct communication through a proxy server. If you are performing advanced troubleshooting or want to learn more about HTTP communication, you can find out more about using WFetch here.
Troubleshooting Basic Network Connectivity Using A Telnet Client
The telnet client included with Windows is a useful low level diagnostic tool. When troubleshooting a network connectivity issue, it is a simple and effective way to determine if you can establish a TCP connection with a remote host on a particular port. The command syntax is:
telnet <IP address, FQDN or hostname> <port>
For example…
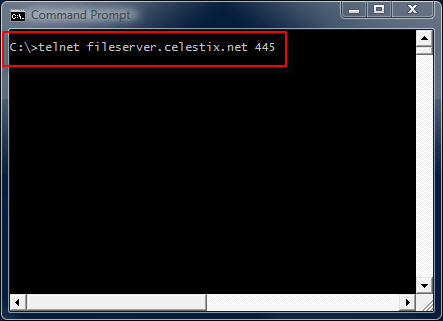
telnet fileserver.celestix.net 445
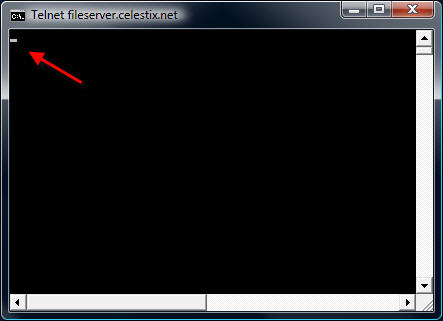
This command instructs the telnet client to open a TCP connection to the server fileserver.celestix.net on port 445 (which is used by SMB). A successful TCP connection was made if the command prompt disappears and you are left with only a flashing cursor.
You can confirm this by monitoring the communication with a protocol analyzer (e.g. Network Monitor or Wireshark) when you execute the command.
Note: The example above uses a fully-qualified domain name (FQDN). When using FQDN’s or hostnames, make certain that name resolution is working properly if you are unable to establish connectivity.
Additional Examples
telnet dc01 389
This command establishes connectivity to dc01 on TCP port 389 (LDAP).
telnet 192.168.1.100 3389
This command establishes connectivity to 192.168.1.100 on TCP port 3389 (RDP).
Unable To Connect
If a connection cannot be established you will receive the following error message:
Could not open connection to the host, on port <port number>: Connect failed
This error message does not explain why the connection could not be established, however. It may be that the remote host was not listening on the specified port, the remote host was not reachable, or perhaps a firewall on the remote host or in the network path between the client and the remote host denied the connection. Looking at the communication with a protocol analyzer provides more information. For example, if the remote host is reachable but not listening on the port requested, the remote host will reply with a TCP reset.

If the remote host was not reachable or a firewall denies the communication there will be no replies.

Telnet Clients
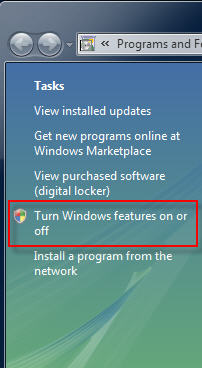
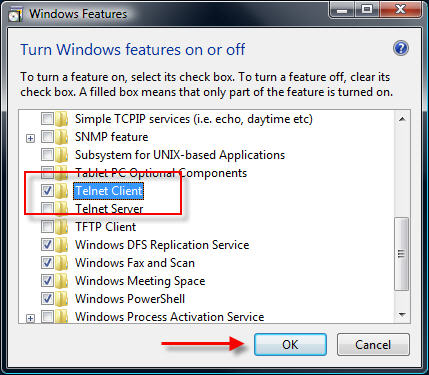
Historically the telnet client has been installed by default on all Windows operating systems. That changed beginning with Windows Vista. With Windows Vista and Windows 7 you will need to open the ‘Programs and Features’ control panel application and in the task pane select the option to ‘Turn Windows features on or off’.
Select ‘Telnet Client’ and choose ‘Ok’ to install it.
On Windows Server 2008 systems it is even easier to install the telnet client. From an elevated command prompt enter the following command:
servermanagercmd -i telnet-client
In addition there are numerous third-party telnet clients available for Windows. Some are free such as the popular Putty telnet client, and some are commercial such as SecureCRT. Third-party telnet clients offer advanced featuers not found in the native Windows telnet client and also support additional protocols such as SSH and RLogin.
In my next post I will demonstrate how to perform basic HTTP troubleshooting using a telnet client.
