Search Results
Configuring Splunk Universal Forwarder on Forefront TMG 2010
Aggregating logged data from security devices such as the Forefront Threat Management Gateway (TMG) 2010 firewall is a top priority for many security engineers. Forefront TMG and its predecessor, ISA Server, have always lacked an integrated facility to forward logged data to an external event management system. Often the administrator will have to devise an elaborate process that consists of batch files or scripts that collect firewall and web proxy logs and copy them to another location where they can be consumed. In the past I’ve demonstrated how third-party utilities can convert firewall log data to the syslog format as well.
Splunk is one of the more popular log management systems in use today, and to make it easier to get Forefront TMG log data in to Splunk we can use the Splunk Universal Forwarder. The Universal Forwarder is a utility that installs on the Forefront TMG firewall and monitors the folder containing W3C formatted text log files. The Universal Forwarder has a small footprint and consumes few resources, making it the ideal method to collect Forefront TMG log data and deliver it to the Splunk indexing server for analysis and archiving. The Splunk Universal Forwarder can be downloaded here.
Configuring Forefront TMG 2010
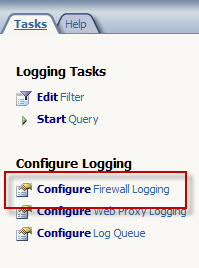
Before installing the Universal Forwarder, the Forefront TMG firewall must be configured to log to text file format. To change the log file format, open the Forefront TMG management console and highlight the Logs & Reports node in the navigation tree, select the Logging tab in the center console window, and then click Configure Firewall Logging in the Tasks pane on the right.
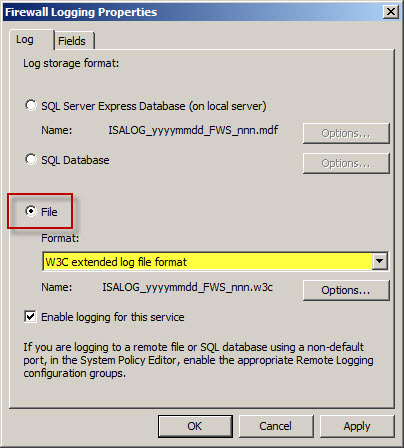
Select the option to log to File and choose the W3C extended log file format from the drop down box below. Repeat these steps to configure web proxy logging.
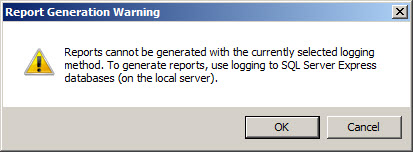
When the option to log to text file format is chosen, native Forefront TMG reports cannot be generated and access to historical log data in the Forefront TMG management console is no longer possible. Clicking Ok will generate the following warning message:
Reports cannot be generated with the currently selected logging
method. To generate reports, use logging to SQL Server Express
databases (on the local server).
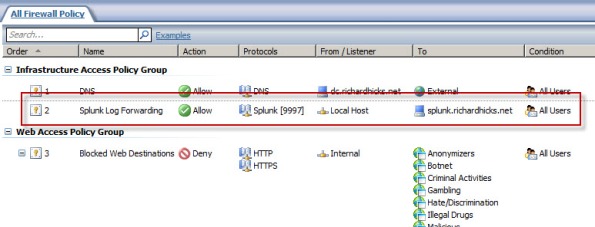
An access rule must be created to allow the Splunk Universal Forwarder to communicate with the Splunk indexing server. The source will be the local host network, the destination will be the Splunk indexing server, and the protocol will be TCP 9997 (outbound), which is the default port used by the Splunk Universal Forwarder.
Configuring Splunk Universal Forwarder
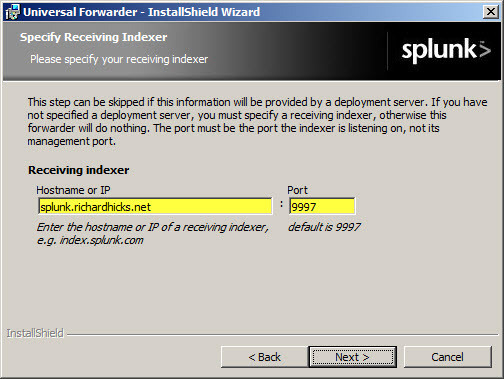
Next, install the Splunk Universal Forwarder on the Forefront TMG firewall. When prompted, enter the hostname, FQDN, or IP address of your indexing server and specify a TCP port to use (the default is TCP port 9997).
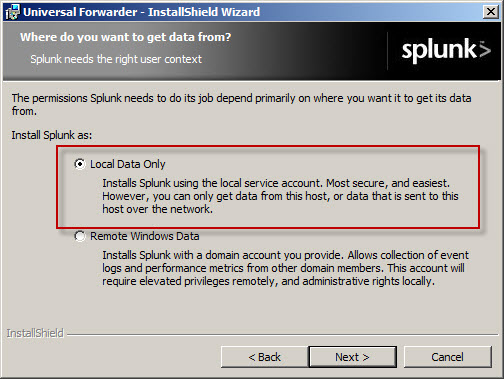
Select the option to forward Local Data Only.
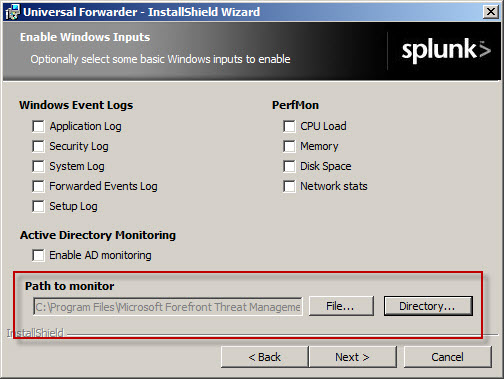
The Forefront TMG firewall will create new text log files each day and store them in the specified log files folder. Specify a Path to monitor by clicking Directory… and selecting C:\Program Files\Microsoft Forefront Threat Management Gateway\Logs (or the path where your log files are stored, if different from the default).
Configure Splunk Indexing Server
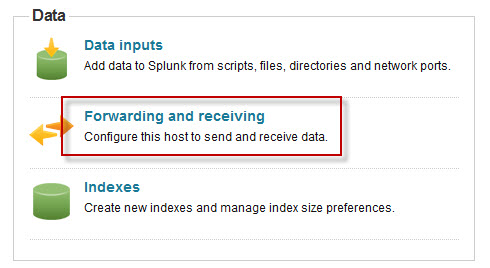
Once the installation is complete, open the Splunk Manager and click Forwarding and receiving.
Click the Add new link next to Configure receiving.
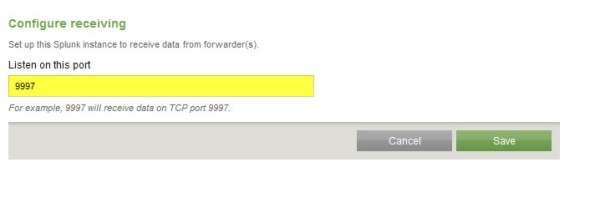
Configure the indexing server to Listen on this port and enter 9997.
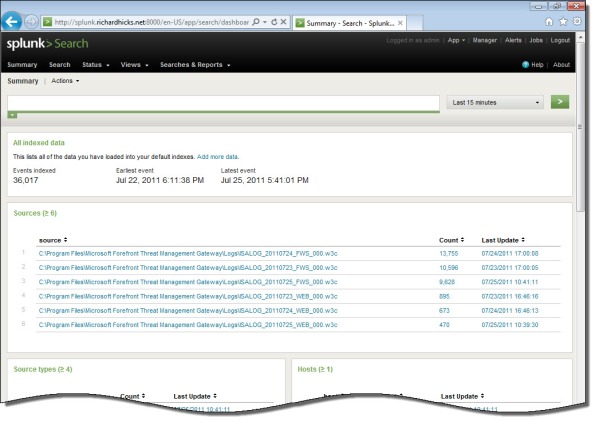
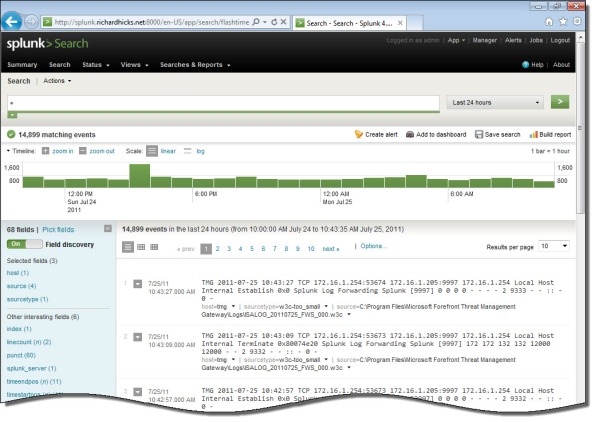
Once you’ve configured Splunk to receive data from the forwarder, Forefront TMG firewall and web proxy log data should appear on the indexing server.
Vulnerability in the Forefront TMG 2010 Client Could Allow Remote Code Execution
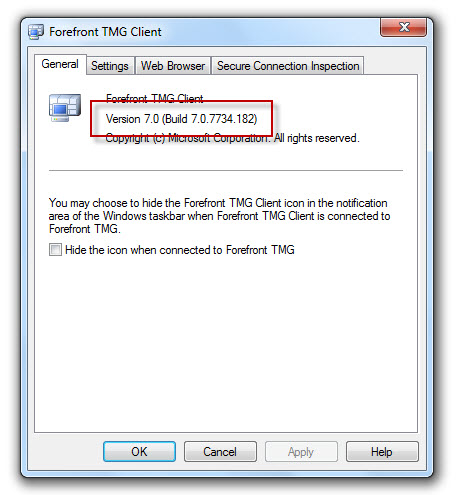
It is extremely rare to see a security update for anything relating to the Forefront TMG firewall. However, the June 2011 security bulletin includes update MS11-040 that addresses a privately reported vulnerability in the Forefront TMG client that could allow remote code execution. This security update applies only to the Forefront TMG client, not the firewall itself. Also, it does not apply to previous versions of the ISA firewall client.
Before applying the MS11-040 update, the latest version of the Forefront TMG client was build 7.0.7734.100. After applying the MS11-040 update, the new build number will be 7.0.7734.182.
Forefront TMG 2010 Web Proxy Auto Detect Fails
Recently I received a call from a customer who was trying to resolve an issue where all web proxy clients that were configured to use Web Proxy Auto Discovery (WPAD) with DNS suddenly stopped working. We began troubleshooting by confirming that the hostname WPAD resolved to the internal IP address of the Forefront TMG firewall, which it did correctly. Next we used a telnet client to confirm that the TMG firewall was listening on TCP port 80 (used by TMG for DNS WPAD clients) and indeed it was responsive. A scan of the event logs on the firewall turned up the following warning message:
“The Web Proxy filter failed to bind its socket to 172.16.1.253 port 80. This may have been caused by another service that is already using the same port or by a network adapter that is not functional. To resolve this issue, restart the Microsoft Firewall service. The error code specified in the data area of the event properties indicates the cause of the failure.”
Something was listening on TCP port 80, so we opened a command prompt and entered the following command in order to determine which process was listening on this port:
netstat –ano | findstr :80
Netstat was reporting that TCP port 80 was in a listening state and bound to the IP address 172.16.1.253. The process using this port was the System process (PID 4). This is unexpected, because the Forefront TMG web proxy service (wspsrv.exe) should be bound and listening on this port. Clearly this was a web service hijacking this port, so to find out more we entered the following command at a command prompt:
netsh http show servicestate
The output of this command revealed a valuable clue. Notice the registered URL below…
HTTP://172.16.1.253:80:172.16.1.253/REPORTSERVER_ISARS/
As it turns out, this customer had attempted to change the SQL Reporting Services Web Service URL. By assigning the Forefront TMG firewall’s internal IP address and changing the port to 80 in the Reporting Service Configuration Manager, this caused a conflict with the Forefront TMG web proxy filter, which requires TCP port 80 to provide WPAD for DNS.
To resolve the issue, the administrator chose a TCP port other than 80 and restarted the system.
Relocating SQL Database Files on Forefront TMG 2010
When Forefront Threat Management Gateway (TMG) 2010 is installed, an instance of SQL Server 2008 Express is included for Forefront TMG firewall and web proxy logging. By default, the log database files are installed on the system partition, which is less than ideal. Best practices dictate that log database files should reside on a separate, dedicated partition.
I’ve had many people ask how to move these database files once the product is installed. Most assume that the process involves using SQL database management tools to detach the database and manually move the database files to a new partition. Not true! Since Forefront TMG handles all of the underlying SQL database management, the process is actually quite simple.
To move the log database files, first create a folder to store them in the new location. Next, open the Forefront TMG management console, highlight Logs & Reports in the navigation tree, select the Logging tab in the center console window, then click Configure Firewall Logging in the Tasks pane on the right.

Click the Options… button, then select This folder (enter the full path): and enter the new path to store the log database files.

For EMS-managed or standalone arrays, make certain this path exists on each array member. If it does not, the service will not start. If the folder does not exist, TMG will complain.

Repeat this process to move the web proxy log database files. In addition, it would be an excellent idea to also move the Log Queue Storage Folder. This folder should be located on a partition that is separate from the one used to store the log database files. For optimum availability this will be a separate physical disk, allowing for Forefront TMG to continue logging to the queue even in the event of a physical disk failure where the log database files are stored. As with the log database files, this folder must exist on each array member.

A system variable can be used to specify the path to log database or log queue files. For example, %LOGDRIVE%\FWS, where %LOGDRIVE% can be a different drive letter and path on each array member, if necessary. To create a system variable, open the advanced system properties and click Environment Variables….

Under System variables click New…, enter the variable name (e.g. LOGDRIVE), and specify the location where the log files should be stored on this array member (e.g. D:\TMGLogs). Repeat these steps on each array member, specifying the local path where log database files are to be stored.

Confirm the system variable was created properly by opening a command prompt and entering the following command:
set logdrive
The output for our example should appear as follows:
LOGDRIVE=D:\TMGLogs
Forefront TMG Performance Troubleshooting with PAL v2.x Part 1 – Data Collection
Troubleshooting performance issues on any system, especially a Forefront Threat Management Gateway (TMG) 2010 firewall can be a significant challenge for many administrators. The primary tool used for this task is the Windows Performance Monitor. This tool allows the administrator to monitor virtually every aspect of the operating system, applications, and hardware. However, deciding which objects and counters to monitor and how to interpret the data can be difficult.
That’s where Performance Analysis of Logs (PAL) comes in. Created by Microsoft Premiere Field Engineer (PFE) Clint Huffman, this free tool automates the analysis of logged data collected using Performance Monitor. PAL uses templates along with user input to analyze and report on the collected log information. It eliminates guesswork by highlighting counters that exceed predefined thresholds. PAL has been around for many years, but until recently has lacked support for Forefront TMG. Thanks to the effort and hard work by some Forefront PFE’s and CSS engineers, the recent release of PAL v2.0.7 now fully supports Forefront TMG.
PAL can be found at http://pal.codeplex.com/. It is available for 32- and 64-bit systems, and requires that Microsoft .NET Framework 3.5 SP1, Microsoft Chart Controls for .NET Framework 3.5, and PowerShell v2.0 be installed.
In this first part of a two-part series we’ll first look at how to use PAL to configure Performance Monitor to collect the necessary data. In the second part will use PAL to analyze the data and generate a report.
Collecting Data
Enabling private Performance Monitor counters is required to fully analyze performance on the Forefront TMG firewall. Enabling private Performance Monitor counters is accomplished be creating the following registry key on the Forefront TMG firewall:
HKLM\SOFTWARE\Microsoft\RAT\Stingray\Debug\FWSRV
"FWS_PRIVATE_PERFORMANCE_COUNTERS"=dword:00000001
Download .reg file here.
To begin collecting performance data on the Forefront TMG firewall, open the PAL tool and select the Threshold File tab, then click the drop-down box and choose Microsoft Threat Management Gateway.
Click Export to Perfmon Template File… and save the file.
On the TMG firewall, open the Performance Monitor, expand Data Collector Sets, and then right-click User Defined and choose New -> Data Collector Set.
Give the new data collector set a descriptive name, select the option to Create from a template, then click Next.
When the wizard prompts for which template to use, click Browse…, then select the PAL template file exported earlier.
Specify the folder where the logged data will be saved and click Finish.
Once complete, the new data collector set will appear. If you right-click the new collector set and choose Properties… you will see that it contains all of the necessary Performance Monitor objects and counters required to perform an in-depth performance analysis of the Forefront TMG firewall. Here you can also change parameters such as the log format (binary log format is recommend, however) and sample interval. You can also change file parameters such as the log file name, the file name format, and the logging mode (overwrite, append, or circular).
To start collecting data, right-click the data collector set and choose Start. Once the capture has started, you can right-click and select Stop to stop the capture.
You can also schedule data collection by right-clicking the data collector set and choosing Properties, clicking the Schedule tab, and then clicking Add.
You can also specify a stop condition that will cease data collection based on any number of different parameters including duration and size of the log file.
In the second part of this two-part series we’ll outline how to use PAL to analyze and generate reports of the Performance Monitor data.
Forefront TMG Performance Troubleshooting with PAL v2.x Part 1 – Data Collection
Forefront TMG Performance Troubleshooting with PAL v2.x Part 2 – Data Analysis and Reporting
More about Determining TMG Version Numbers
A common method for determining the version number for an instance of Forefront Threat Management Gateway (TMG) 2010 is to open the TMG management console and from the drop down menu select Help and About Forefront Threat Management Gateway…

Recently I discovered that this method may not be the most reliable way to determine the TMG version number. After installing Update 2 for TMG SP 1 (version number 7.0.9027.410) I noticed that the TMG management console was still reporting the build number from the previous update (7.0.9027.400 as shown above). However, using the script I demonstrated in a previous blog post the build number is reported correctly as 7.0.9027.410.
To verify the version number once more, I highlighted the System node in the navigation tree and clicked the Servers tab. Here the version number is again displayed correctly as 7.0.9027.410.

The moral of the story here is not to rely only on the Help | About Forefront Threat Management Gateway… drop down menu in the TMG management console to determine the version number. To accurately determine the TMG version, check the version number in the Servers tab of the System node in the TMG management console or use the COM script.
Changing the WebSpy Vantage Scheduled Task Recurrence Interval
There are many third-party reporting tools available today that can aggregate log data for analysis, reporting, and event correlation. One of my favorites for Microsoft Forefront Threat Management Gateway (TMG) 2010 is WebSpy Vantage. Vantage uses its own data stores (called storage), so before you can view logged data or generate reports, you must first import data from your current TMG logging repository (SQL or text file) in to Vantage storage. Once this data has been imported you can do pretty much whatever you want with it after that.
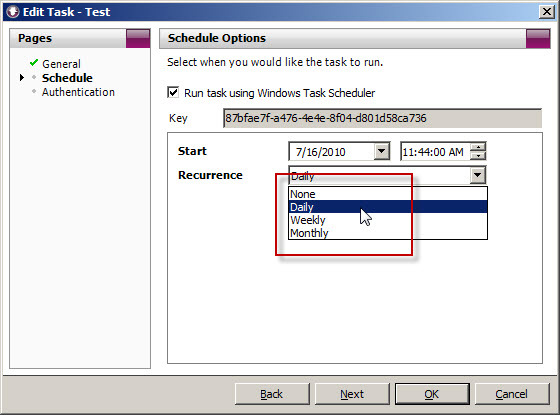
When you create a task to automate the import of log data, you will notice that the Recurrence options are limited to None, Daily, Weekly, and Monthly.
What if you’d like to import the data more frequently than daily? You could create another daily task and schedule that to run daily at a different time, but fortunately there’s an easier way. Since WebSpy Vantage leverages the Windows Task Scheduler, we can use the schtasks.exe command line tool to alter the schedule to run more frequently.
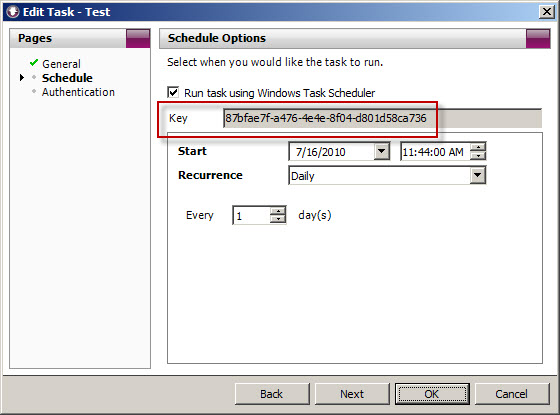
To accomplish this, first copy the Key for the scheduled task you wish to modify.
Next, open a command prompt. The syntax for the command when using Vantage Ultimate is:
schtasks /change /tn “Vantage Ultimate […key…]” /ri <interval_in_minutes>
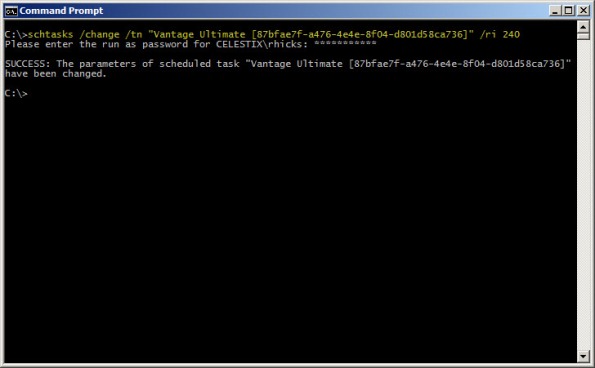
For example, if we want to alter the task above to run every 4 hours, the command would look like this:
schtasks /change /tn “Vantage Ultimate [87bfae7f-a476-4e4e-8f04-d801d58ca736]” /ri 240
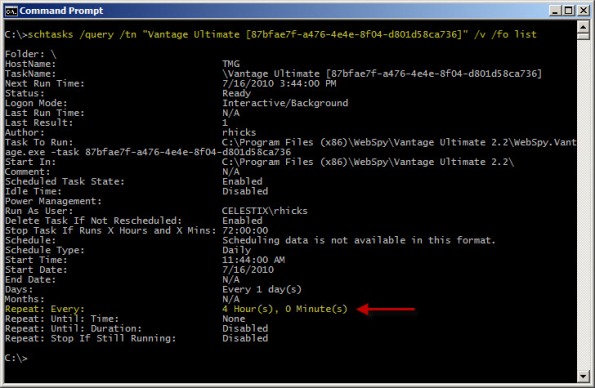
You can verify the new task settings by entering the following command:
schtasks /query /tn “Vantage Ultimate [87bfae7f-a476-4e4e-8f04-d801d58ca736]” /v /fo list
The output will look similar to this:
With schtasks.exe, the interval range in minutes is 1-599940.
Websense Integration Support for Forefront Threat Management Gateway (TMG) 2010
Updated July 11, 2011: Since this post was originally published, Websense now supports full integration with Forefront TMG 2010 with Websense Web Security/Web Filter v7.6.
There seems to be a fair amount of confusion regarding Websense integration support for Microsoft Forefront Threat Management Gateway (TMG) 2010. As you are most likely aware, TMG is 64-bit only and is supported only on Windows Server 2008 64-bit and Windows Server 2008 R2 64-bit. You cannot install TMG on any 32-bit operating system. By contrast, Websense Web Security and Web Filter today (July, 2010) are 32-bit only and are not supported on any 64-bit operating system. These architectural differences clearly limit the integration capabilities for Websense and TMG.
Recently Websense announced the availability of Websense Web Filter and Web Security v7.5, which now includes limited support for integration with TMG. In this release, no Websense components (with the exception of the filtering plug-in) can be installed on the TMG firewall system. In order to support Websense integration with TMG, you must have a separate system or systems on which to install the Websense policy, filtering, user identification, and logging/reporting components. For typical enterprise deployments this won’t be an issue, but this is disappointing news for many small to mid-sized customers who don’t need or want the extra overhead of multiple systems to provide URL filtering services. Another serious limitation is that Websense Web Filter and Web Security v7.5 are currently not supported on Windows Server 2008 R2, at all. If you have installed TMG on Windows Server 2008 R2, you are out of luck.
Thankfully, TMG includes native URL filtering capabilities that, when combined with other TMG advanced protection technologies such as integrated virus and malware scanning, HTTPS inspection, and the vulnerability-based intrusion detection and prevention system, provide a consolidated and comprehensive secure web gateway solution that ultimately affords more overall protection compared to URL filtering solutions alone. TMG includes a 120-day evaluation of these advanced web protection technologies (beginning at the time of product installation, not the activation of the URL filtering feature itself!) so there’s no obligation to try it out. Take it for a test drive…I think you’ll be impressed! It performs well, scales very effectively, and is much easier to manage than many third-party integrations.
Forefront TMG Service Pack 1 – Now Available!
Service Pack 1 for Microsoft Forefront Threat Management Gateway (TMG) 2010 is now available! In addition to the usual bug fixes included in a service pack, this update also includes new features and functionality. Included in TMG SP1 are enhancements to URL filtering, including user override for blocked categories and enterprise-level category override configuration. Reporting has been improved, with a new overall look-and-feel and a user activity report option. In addition, there are new branch office capabilities including support for installing TMG on a domain controller and integration with Windows BranchCache. Also, publishing SharePoint 2010 is now fully supported. For more information, read my full preview of TMG SP1 at ISAserver.org, and download Forefront TMG 2010 SP1 today!
Configuring Syslog on ISA and TMG with Splunk Log Management
[Updated July 26, 2011: You can also use the Splunk Universal Forwarder to deliver Microsoft ISA Server and Forefront TMG 2010 log files to a Splunk indexing server. More details here.]
In a recent ISAServer.org article I wrote about the enhancements made to the logging infrastructure in Microsoft Forefront Threat Management Gateway (TMG) 2010. With regard to logging, one commonly requested feature for ISA and TMG is integration with syslog. Many organizations collect log data from numerous systems and network devices in their environment and aggregate that data in a central repository. This makes auditing, reporting, and event correlation with multiple systems much easier.
Although ISA and TMG do not support syslog natively, this functionality is available by using a free third-party utility. Snare Epilog for Windows is a tool that takes data from ISA and TMG log files and exports them to a syslog server such as Splunk.
Before installing Snare Epilog for Windows you will need to change the Firewall and Web Proxy logging properties to use the text file format. Be advised that when you do this, you will no longer be able to view historical log data in the ISA or TMG management console.
Configure Logging
To configure TMG for text file logging, open the management console and highlight Logs & Reports in the console tree, then select the Logging tab.

To configure ISA for text file logging, open the management console and highlight Monitoring in the console tree, then select the Logging tab.

For both ISA and TMG, click Configure Firewall Logging or Configure Web Proxy Logging in the Tasks pane.

Select the File option and choose W3C Extended Log File Format. Do the same for Web Proxy Logging.

Configure Syslog Access Rule
To allow ISA or TMG to communicate with a remote syslog server, an access rule must be created that allows syslog traffic from the Local Host to the syslog server. This will require a new custom protocol to support syslog (UDP 514) with a direction of send.

Once completed, the access rule should look like this.
Installing and Configuring Snare Epilog for Windows
Download and install Snare Epilog for Windows on the ISA or TMG firewall. For ISA or TMG arrays, install Epilog on each array member. Installation is simple and straightforward – just accept the defaults until completed.
To configure Epilog to send log data to a remote syslog server, such as a Splunk log management server, navigate to Start/All Programs/InterSect Alliance and select Epilog for Windows. On the left side, click Log Configuration.

Click Add, and then in the drop-down box, select Microsoft ISA Firewall Logs.
In the Log File or Directory field, enter the location of the firewall logs. For TMG, the default log folder is C:\Program Files\Microsoft Forefront Threat Management Gateway\Logs. For ISA, the default log folder is C:\Program Files\Microsoft ISA Server\ISALogs. In the Log Name Format: field, enter *FWS*.w3c. Click Change Configuration when finished.
To add Web Proxy log files, repeat the steps above, selecting Microsoft ISA Web Logs as the log type and specifying *WEB*.w3c for the log name format.
Note: For demonstration purposes I have used the default location for the ISA and TMG log files. Best practices dictate that the log files be located on a separate physical disk from the system partition, however.
Click Network Configuration.

Enter the IP address and destination port for your syslog server, and then click Change Configuration.
After completing the log and network configuration, click Apply the Latest Audit Configuration to complete the process.
To confirm that Epilog for Windows is configured correctly, click Latest Events to view the current events. Epilog will display any monitored log information.
If everything is configured correctly and working properly, you should now see ISA or TMG log data in your syslog console. If you do not see log data in your syslog console, you may need to restart the Epilog service on the ISA or TMG firewall.
